Making choropleths with Carto
Choropleth map
Instead of dots and bubbles, we want to use the geographic borders of every town in Massachusetts.
First, we need to find the shapefile.
What is a shapefile? It’s a data storage formate for storing the location, shape, and attributes of geographic features.
Once we get the shapefiles for every town in Massachusetts, we can join the snowfall data to it and make a themed map.
Every state government has a department that keeps track of the this data for planning.
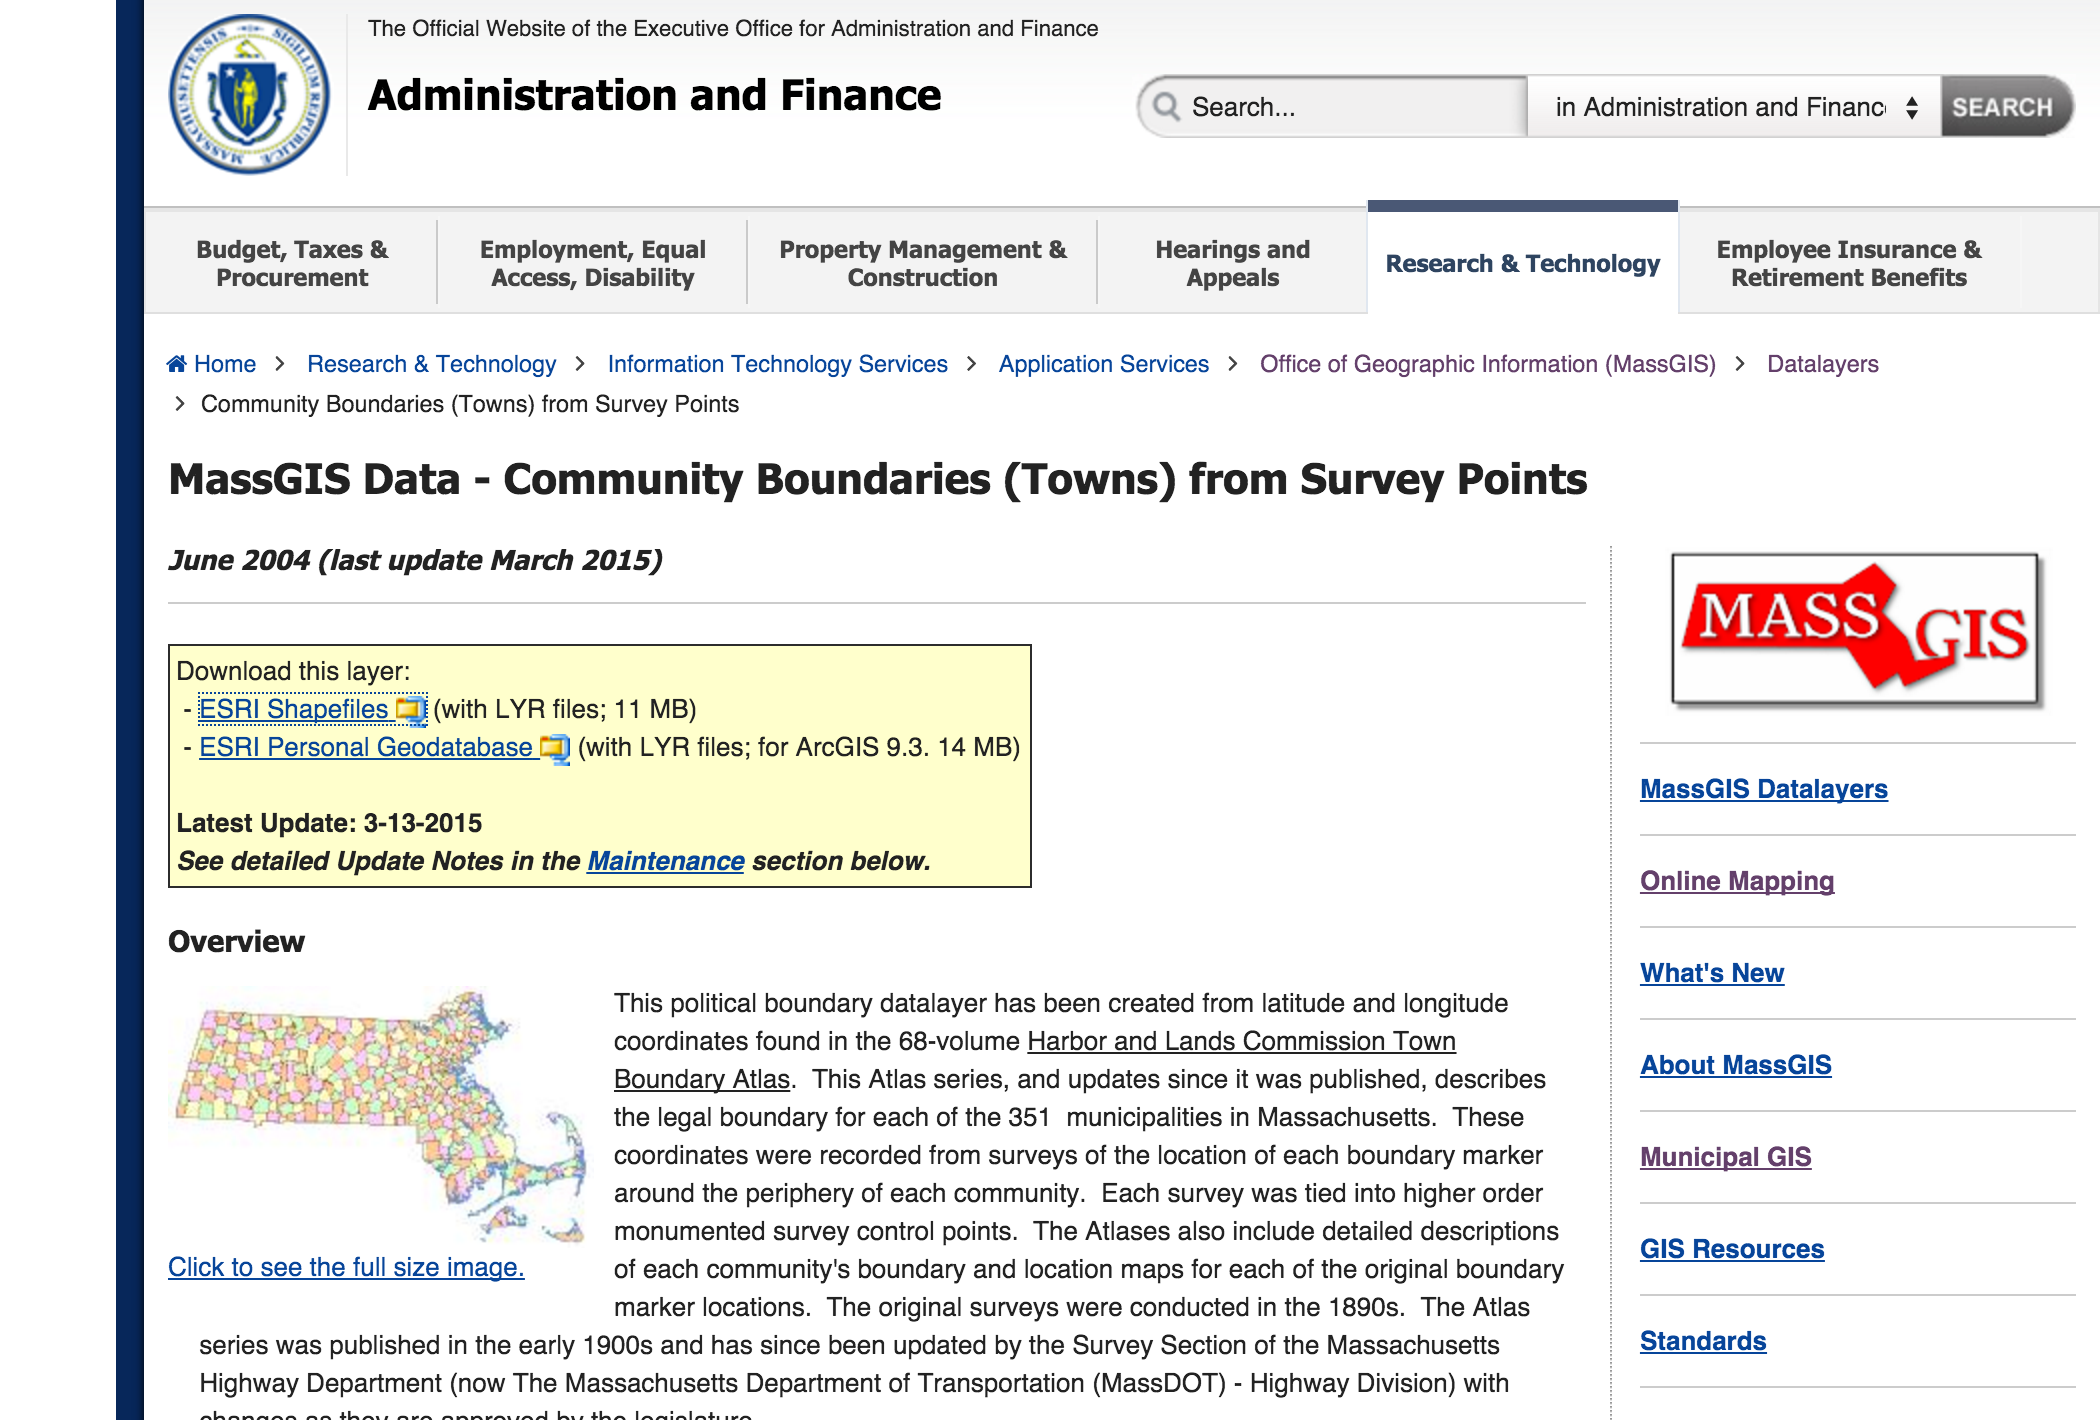
I’ve done the hard work of Googling for you. Here’s where you can get the shapefile: The Massachusetts Office of Geographic Information
Connecticut has a place to get maps, too: UConn MAGIC
Download ESRI Shapefiles from the Massachusetts state site.
Go back to CartoDB’s main Datasets page and click New Dataset.
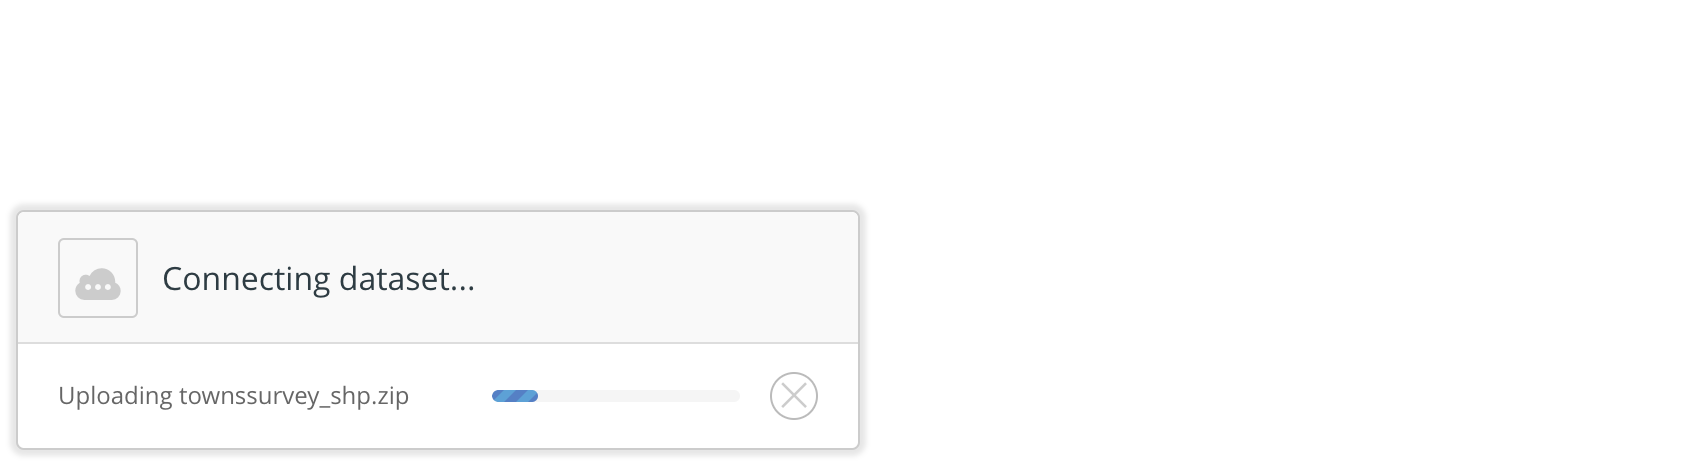
Select the townsurvey_shp zip file.
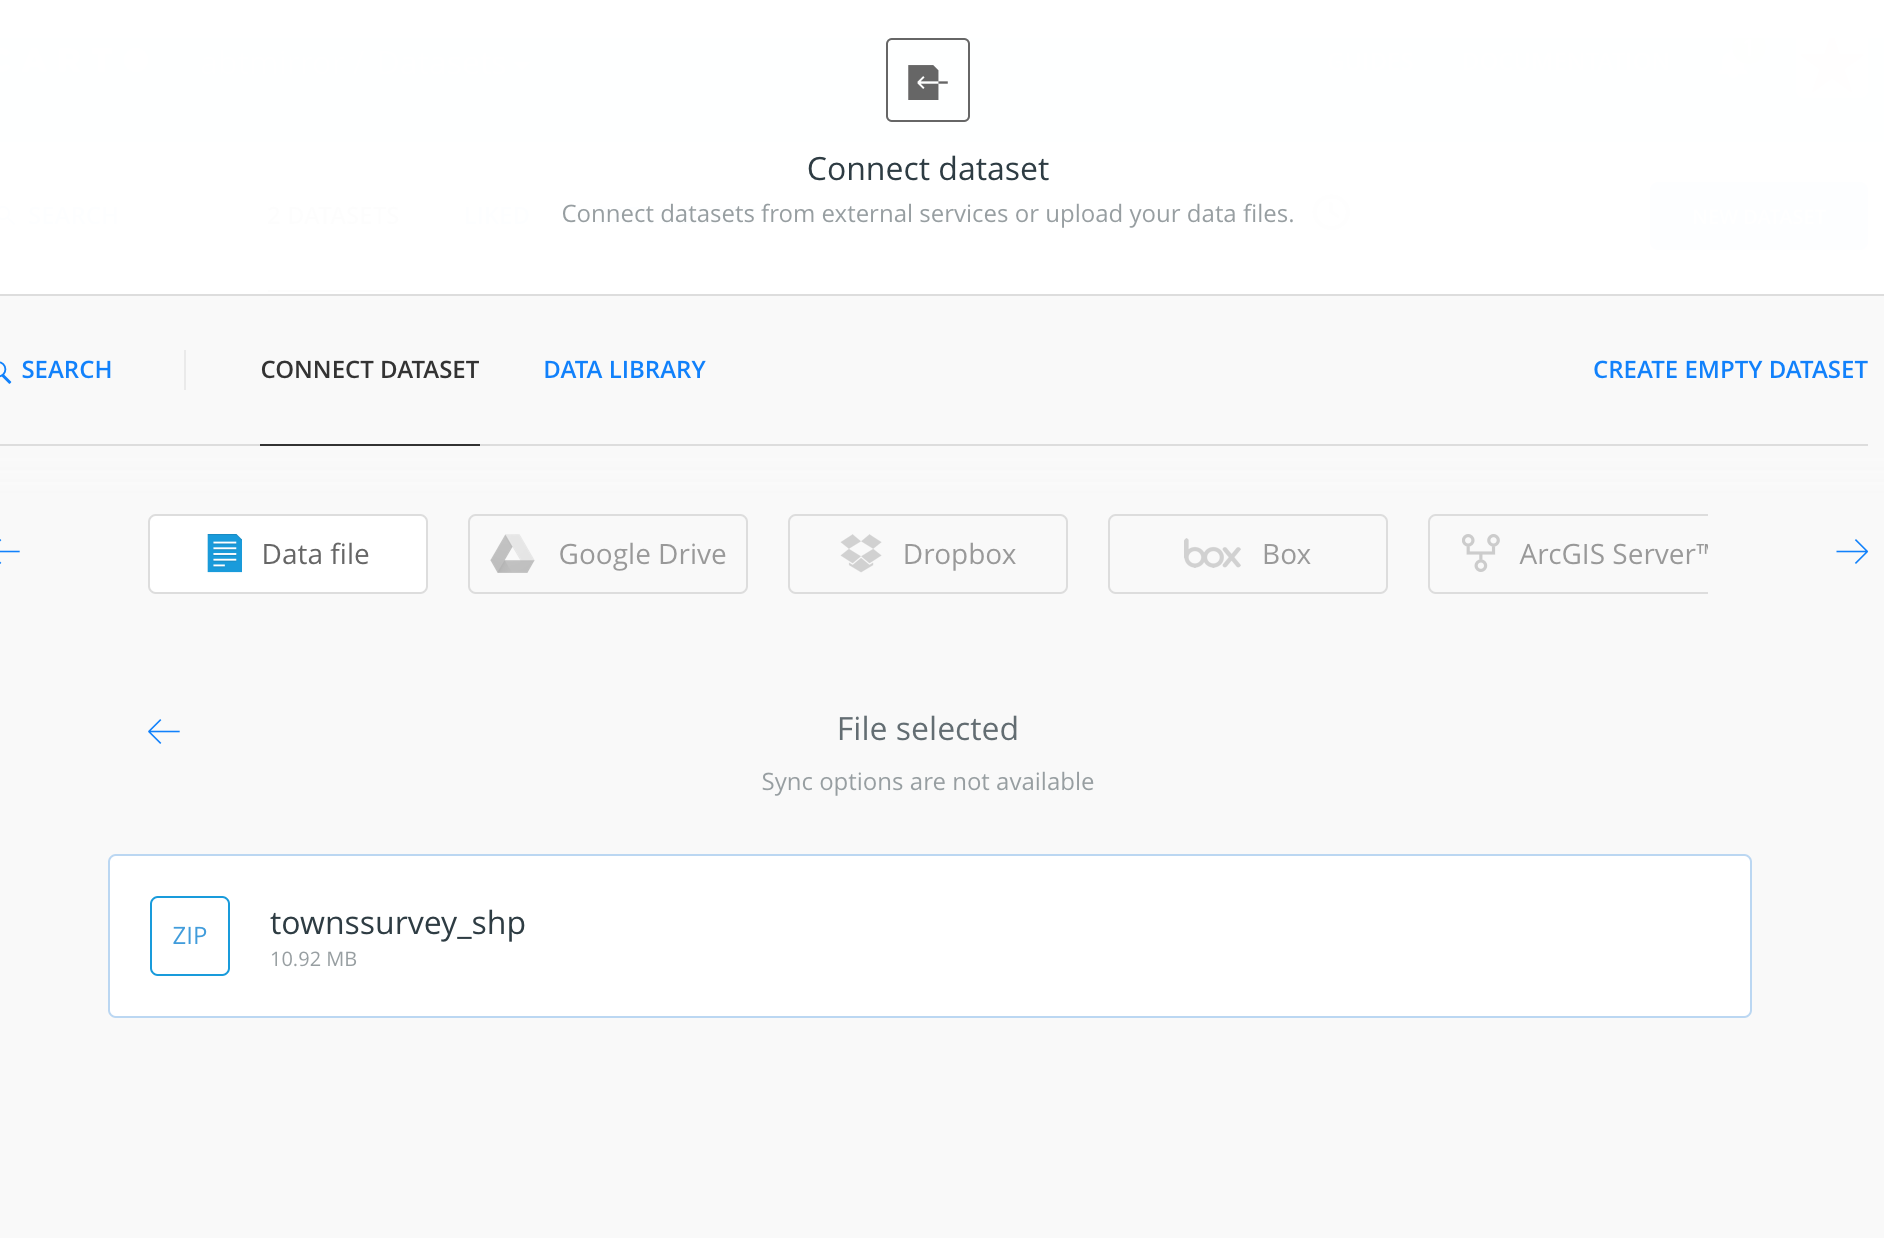
It’ll take a few minutes if the file is large.
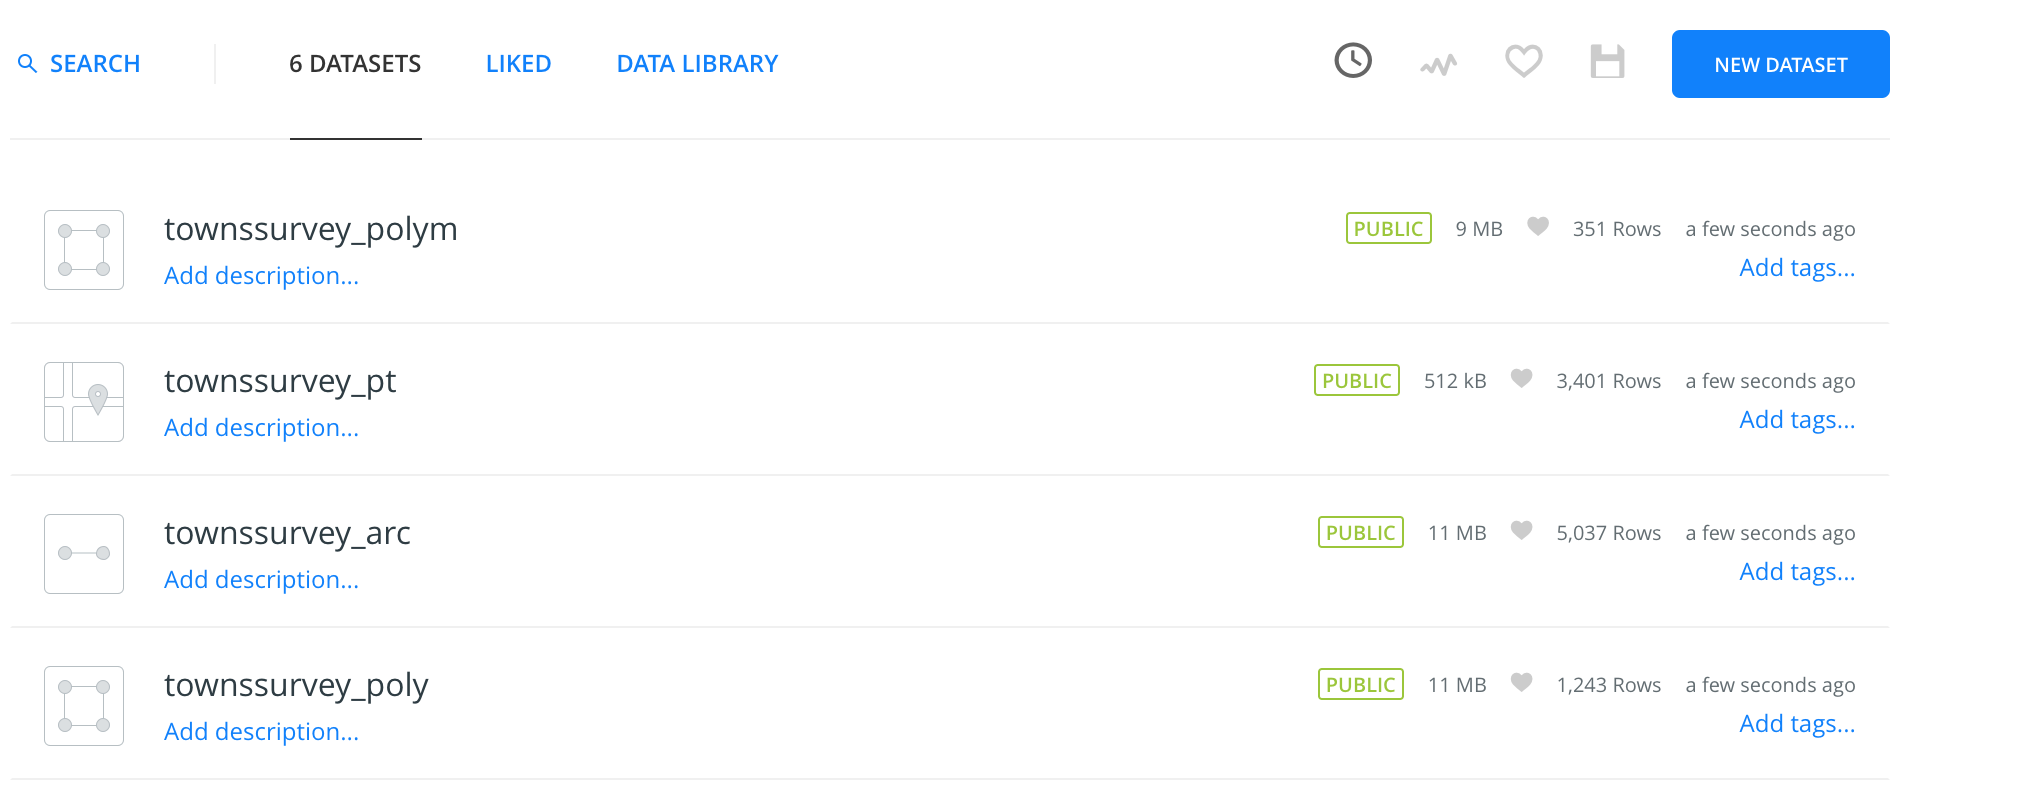
CartoDB will bring in all the files within the zip. There’s a lot of extra stuff. Points and lines and polygons as represented in the box next to the name of the file.
We want to just focus on the polygons. Click on townssurvey_polym.
This is what the data looks like. A lot of columns, including latitude and longitude. Population data was included in this particular shapefile.
If you scroll all the way to the right, you’ll see a column called town with the town name associated with each border. We’ll refer to that later.
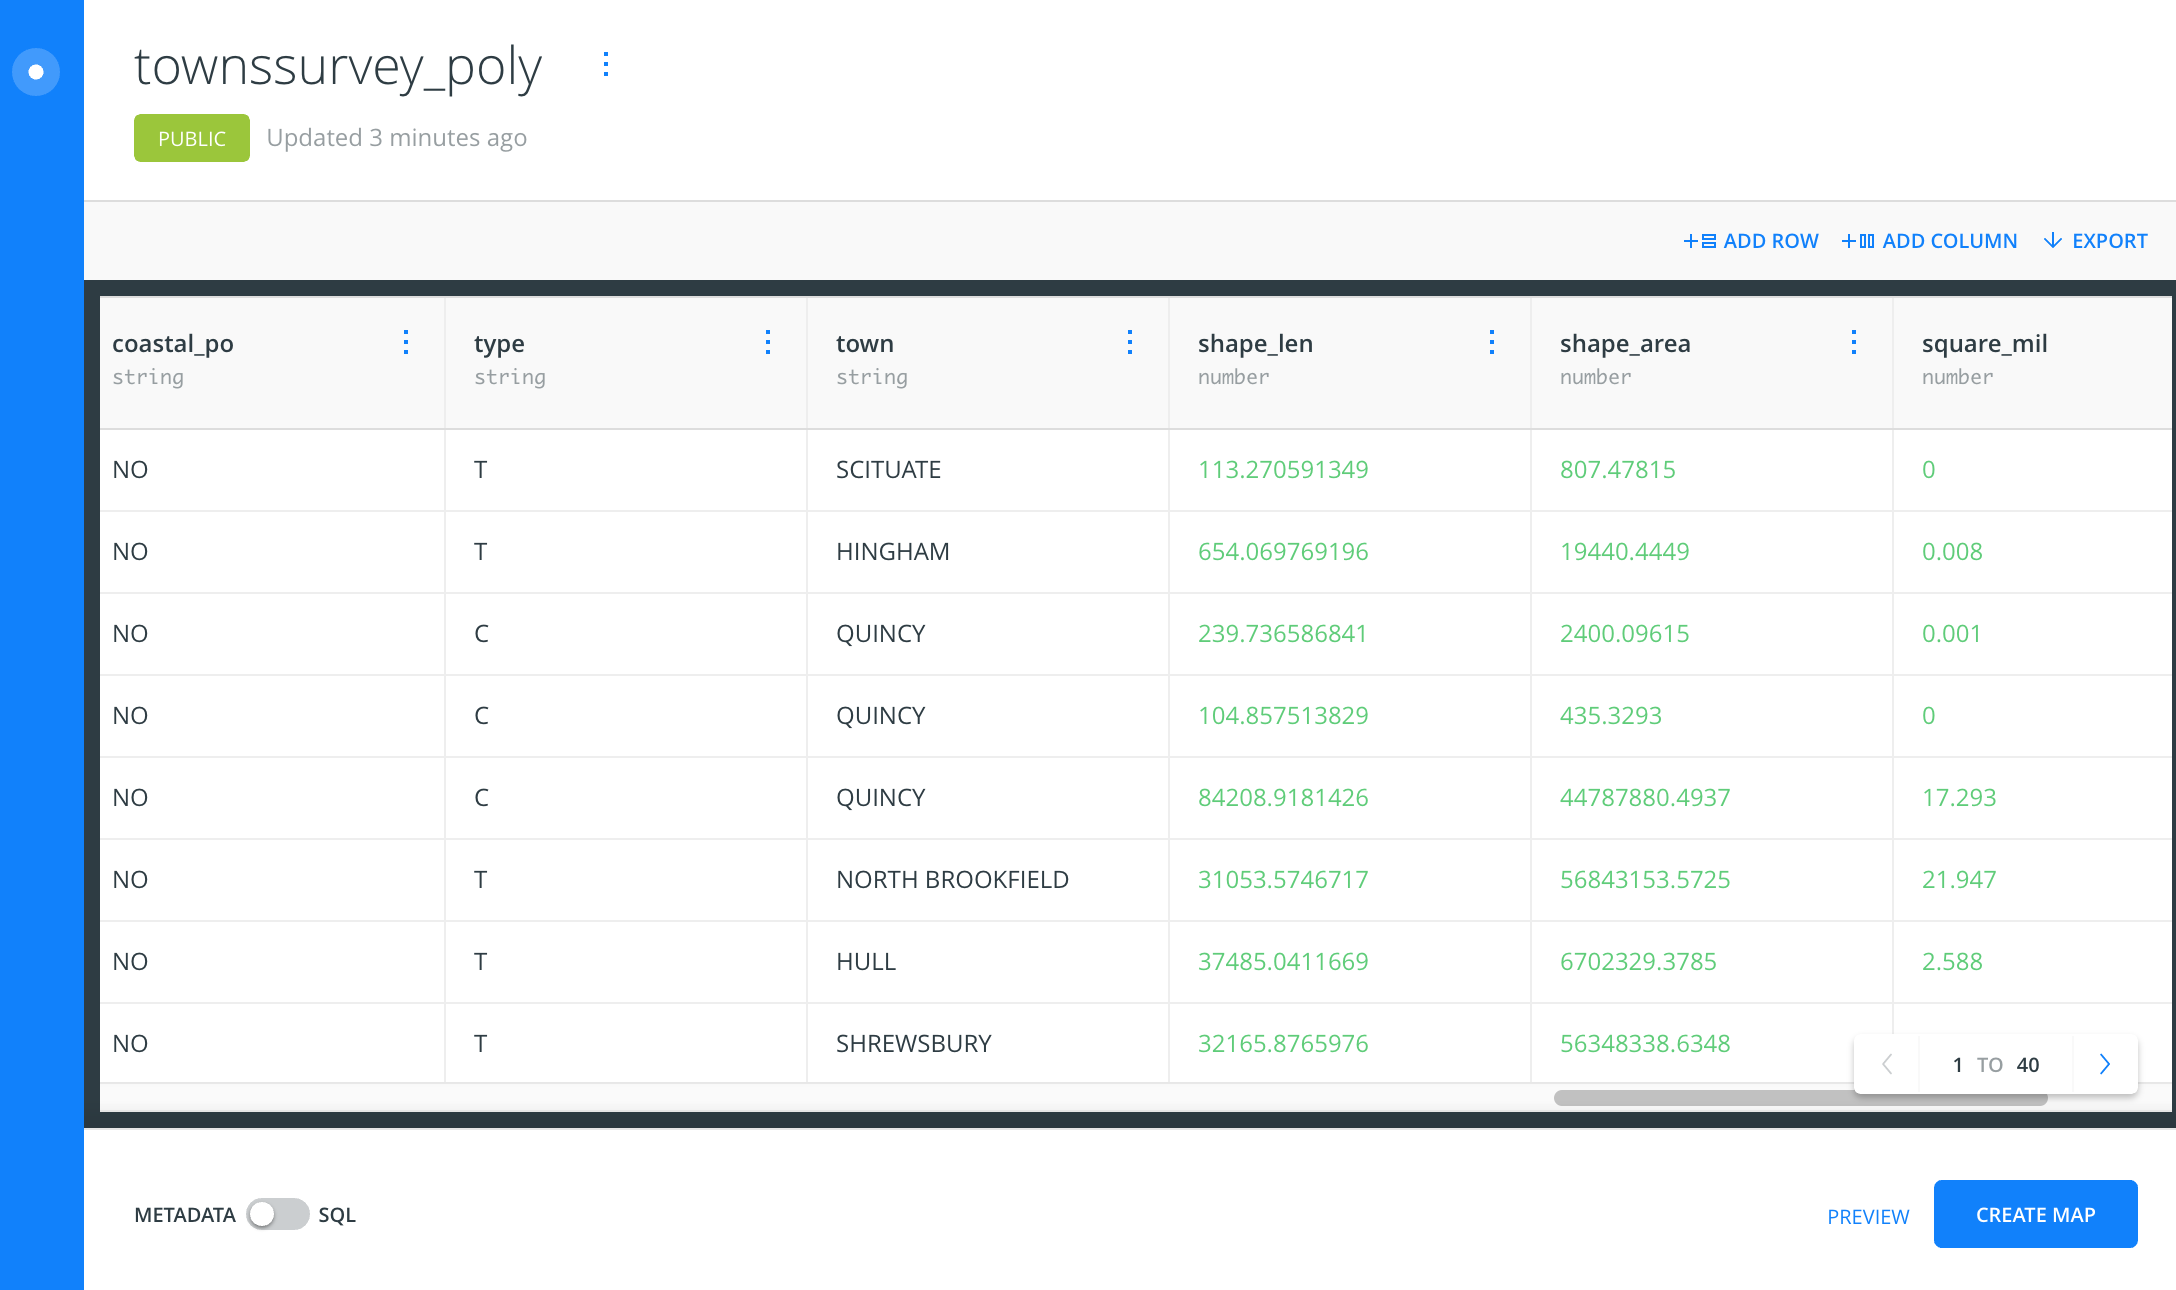
Click Create Map at the bottom right of the data view.
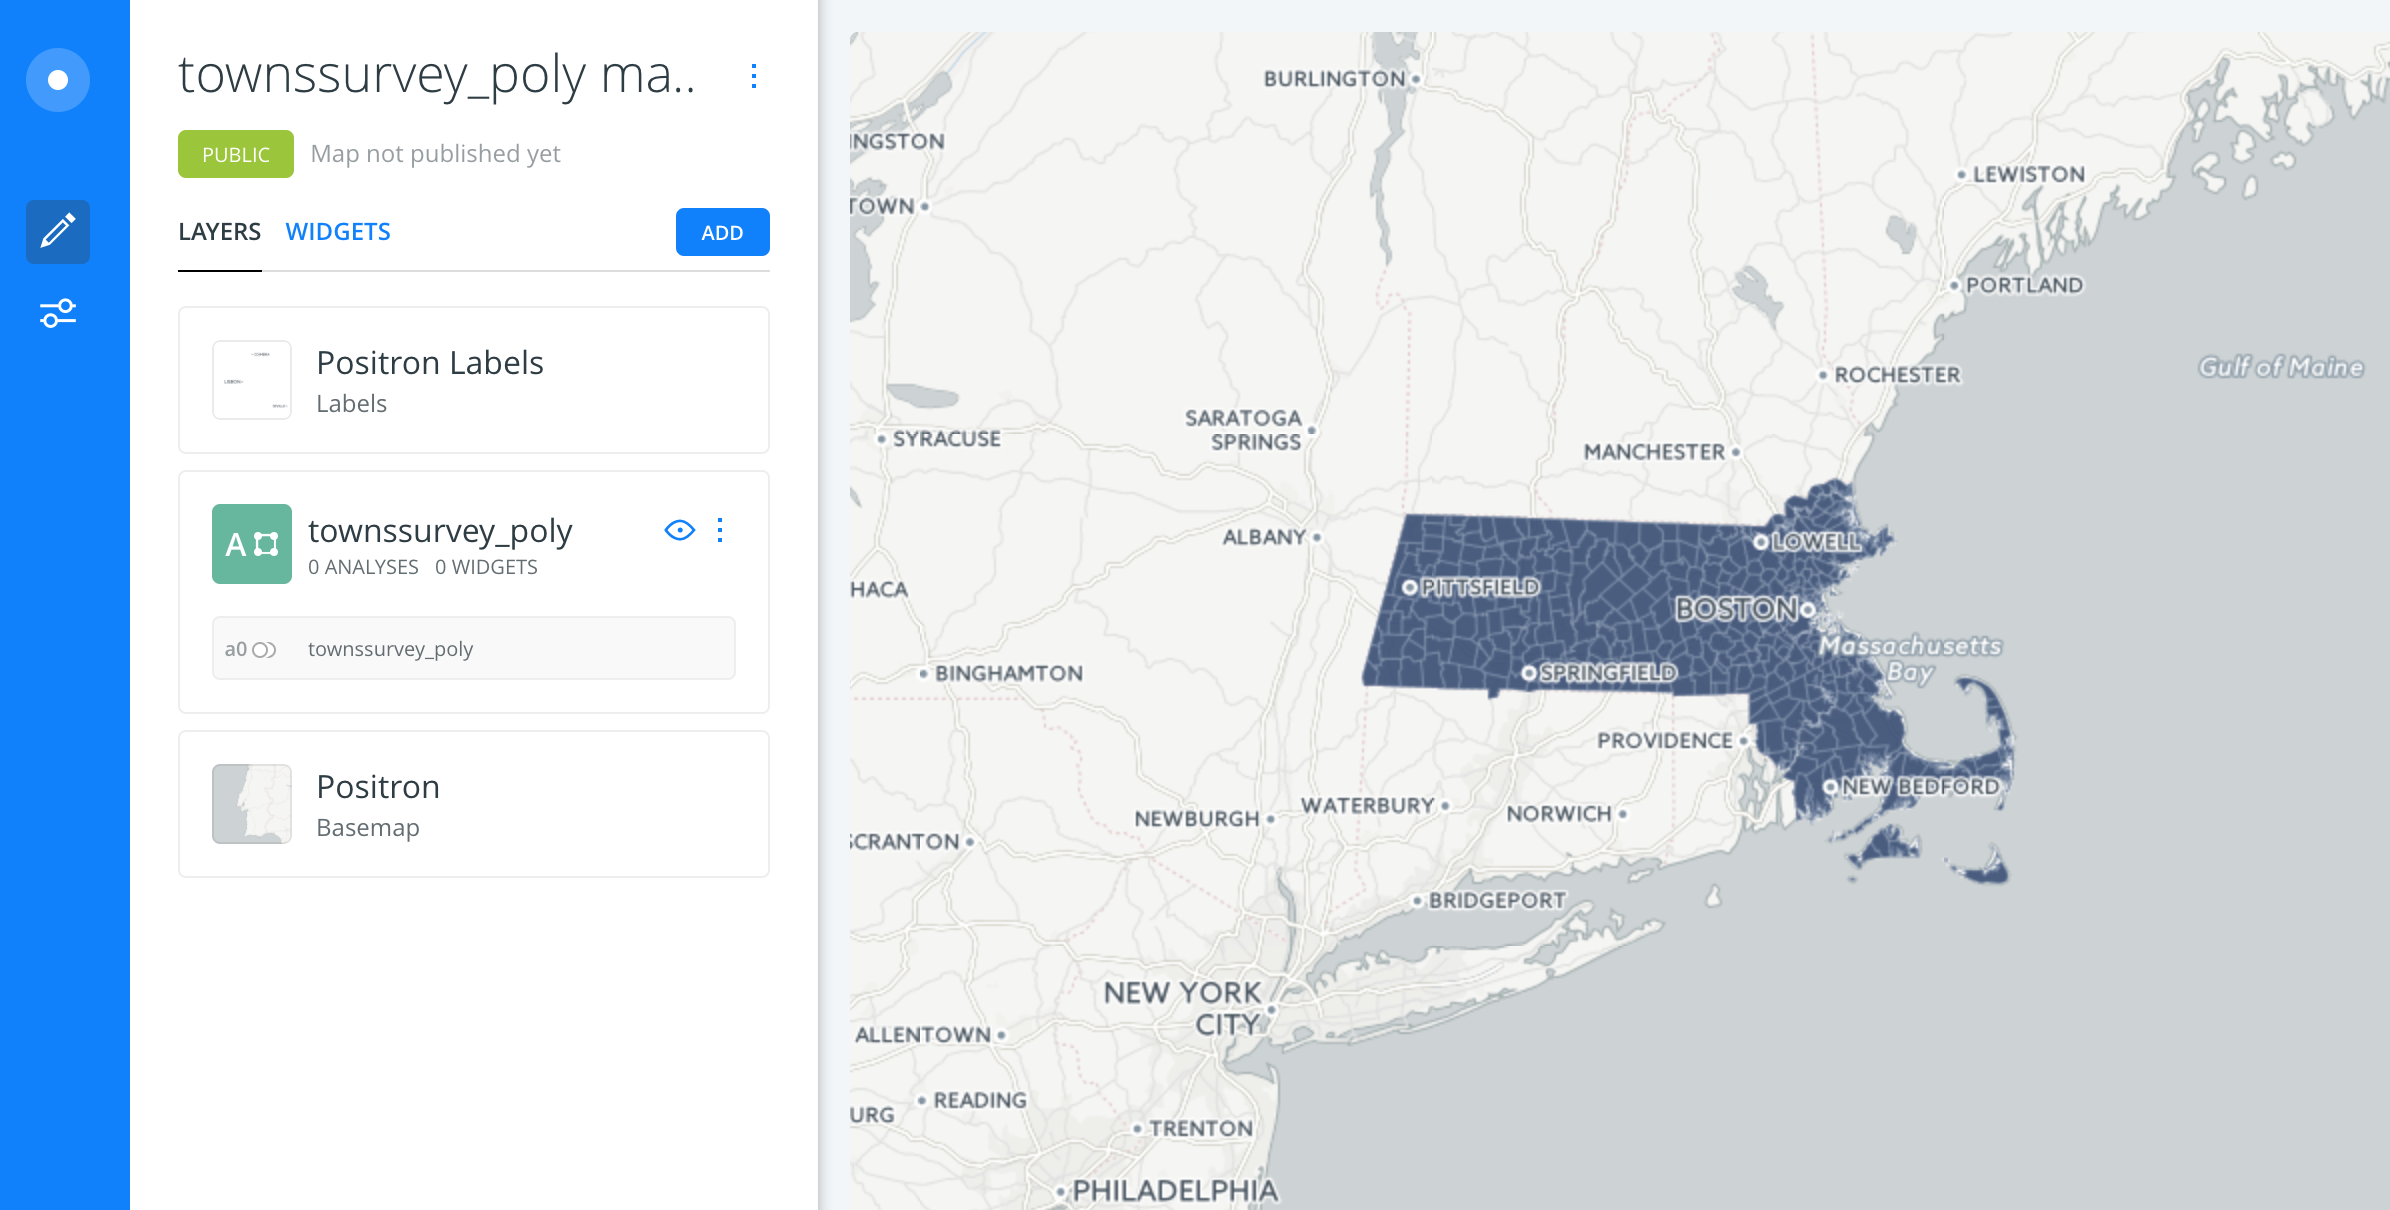
You’re looking at the shapefiles. All the colors are the same, though.
We need to bring the snowfall data over to this shapefile.
In the LAYERS view, click on the ADD button.
Find the data set snowfall and add.
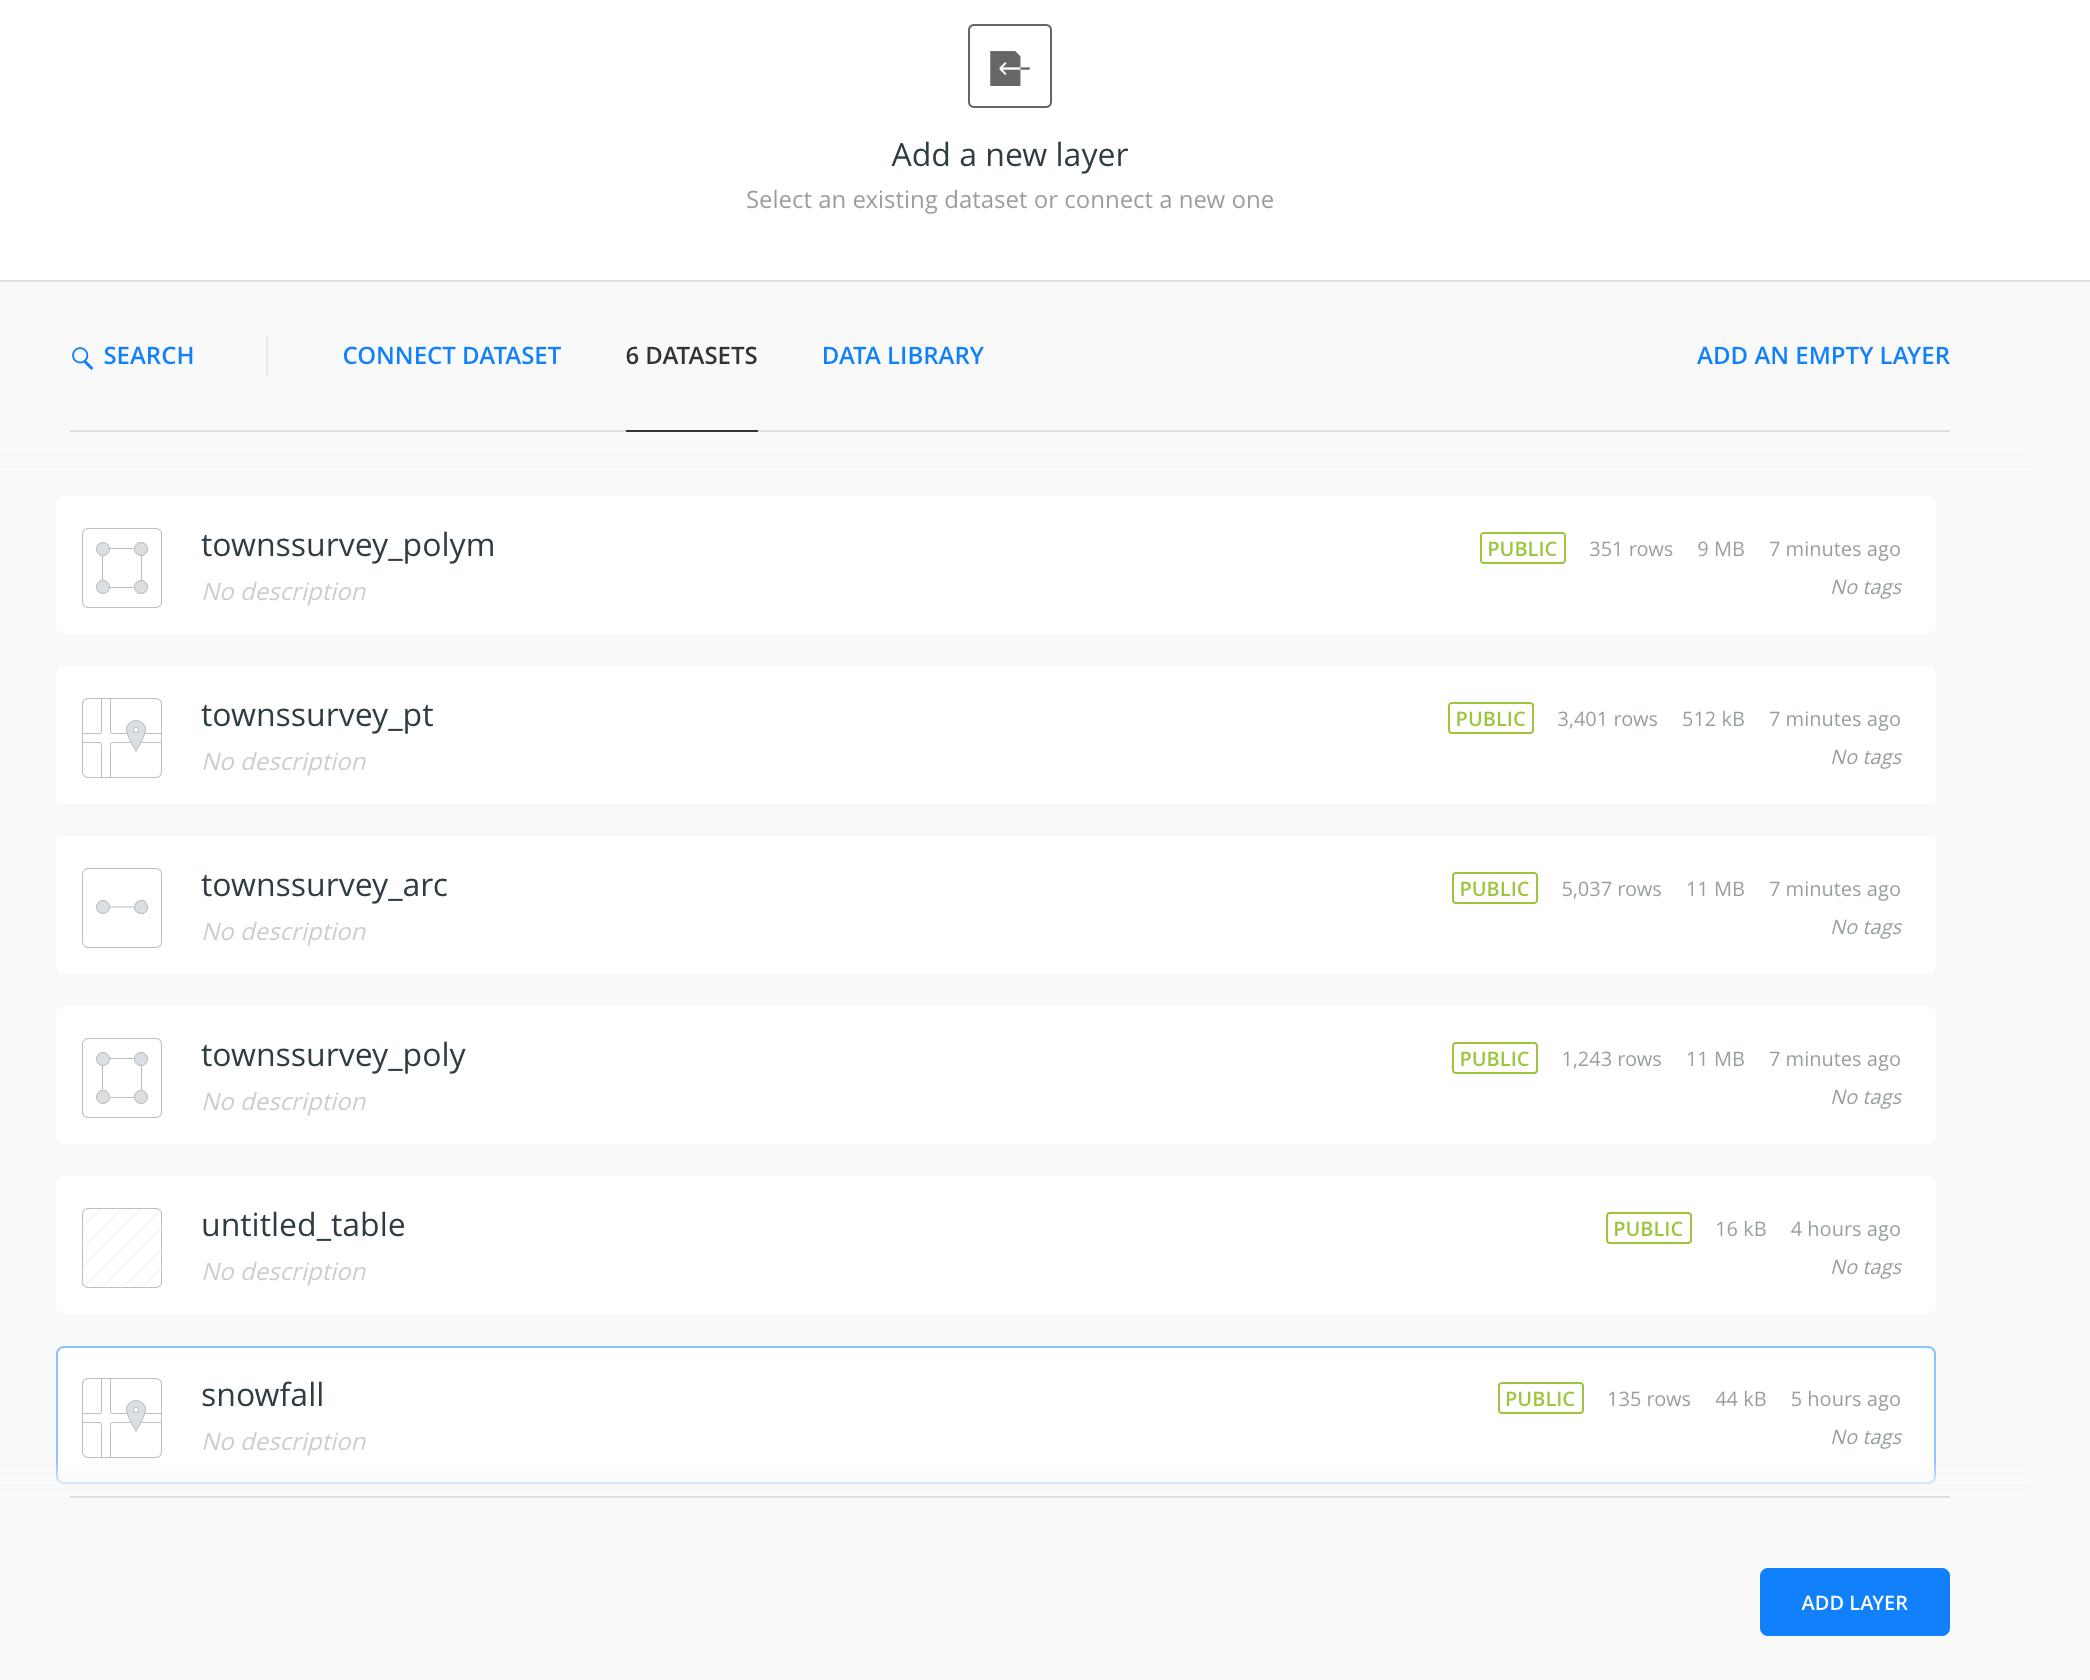
Click on the townsurvey_poly layer.
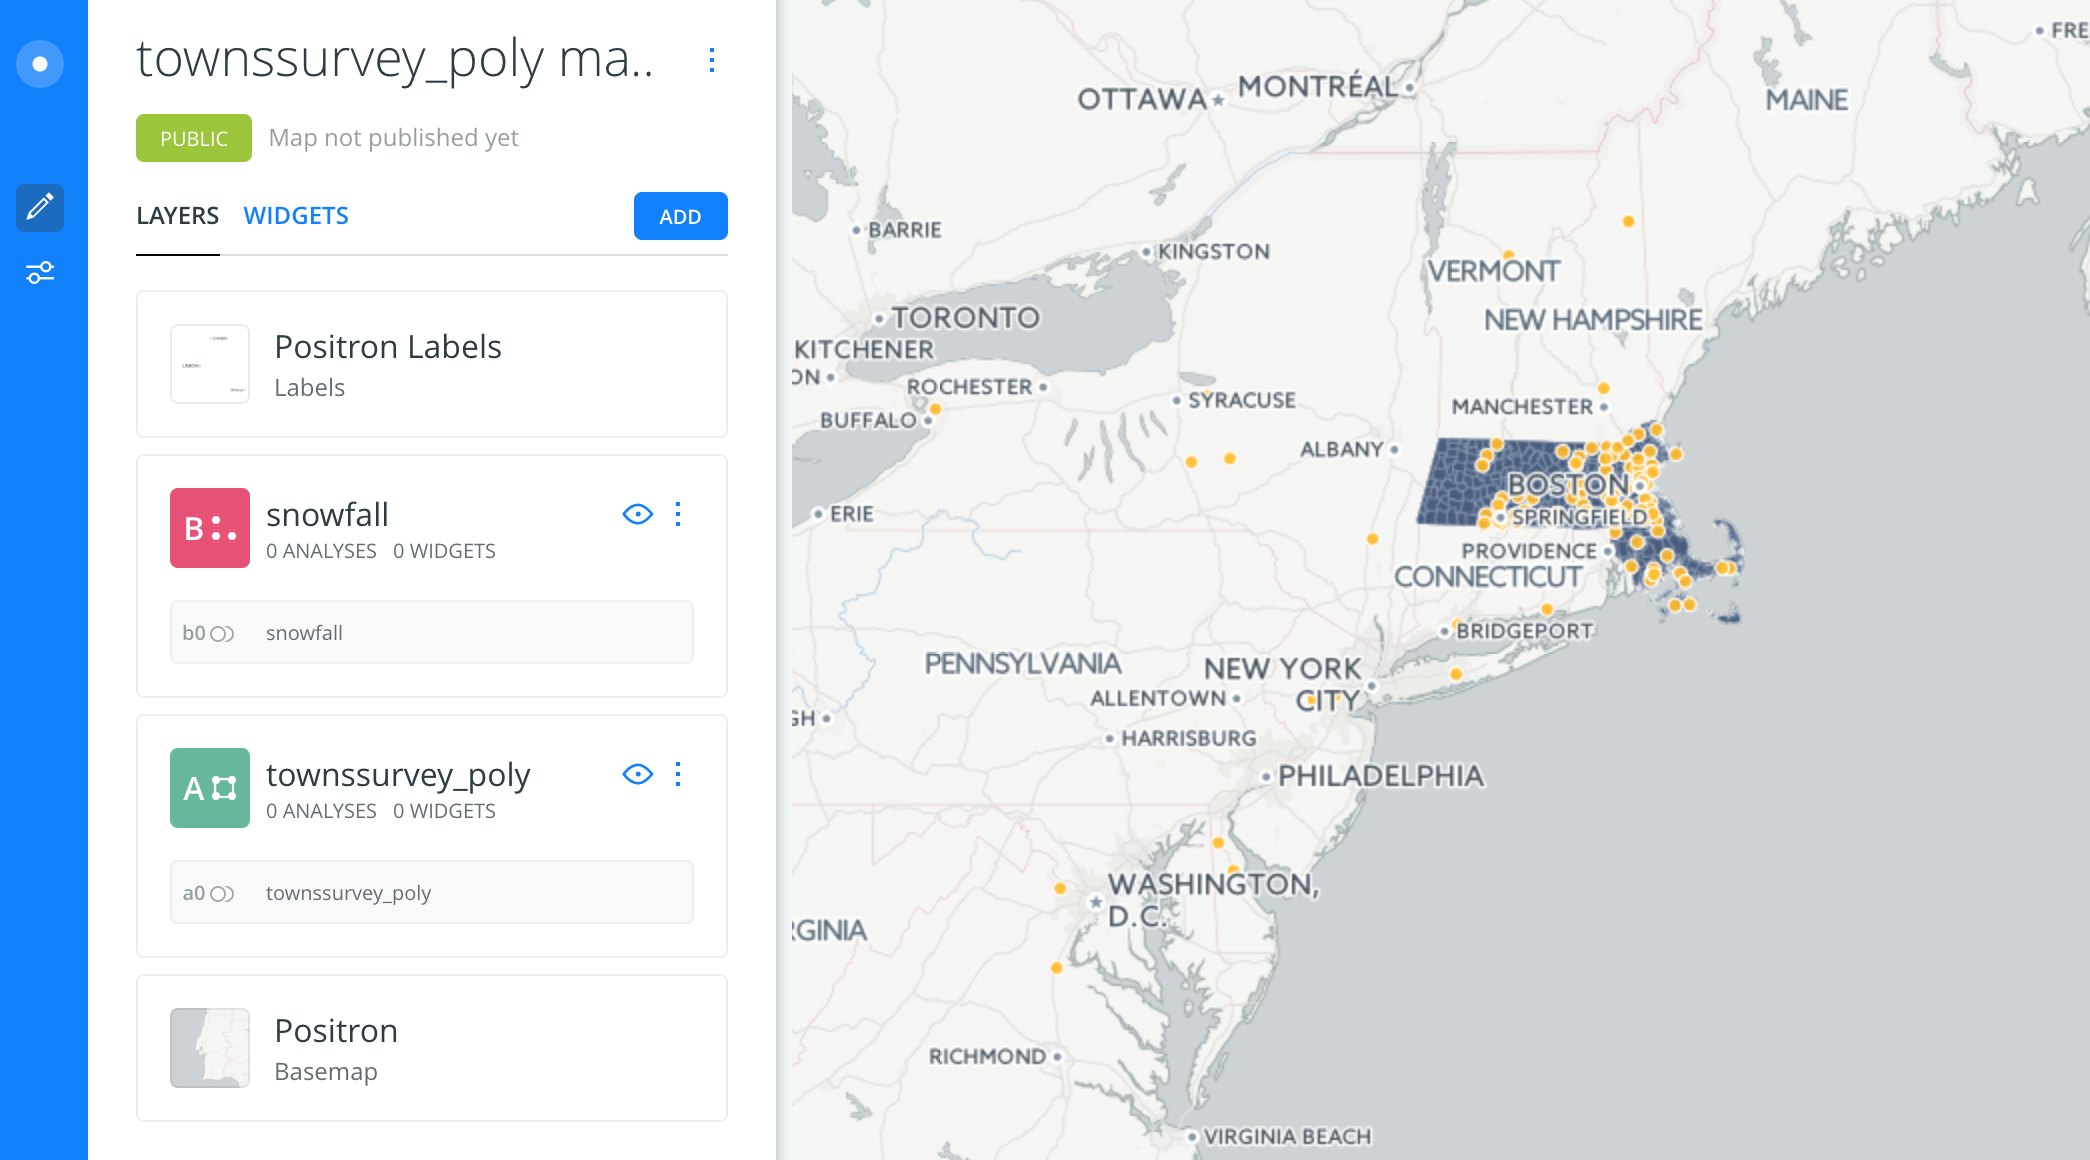
And then click on the ANALYSIS tab.
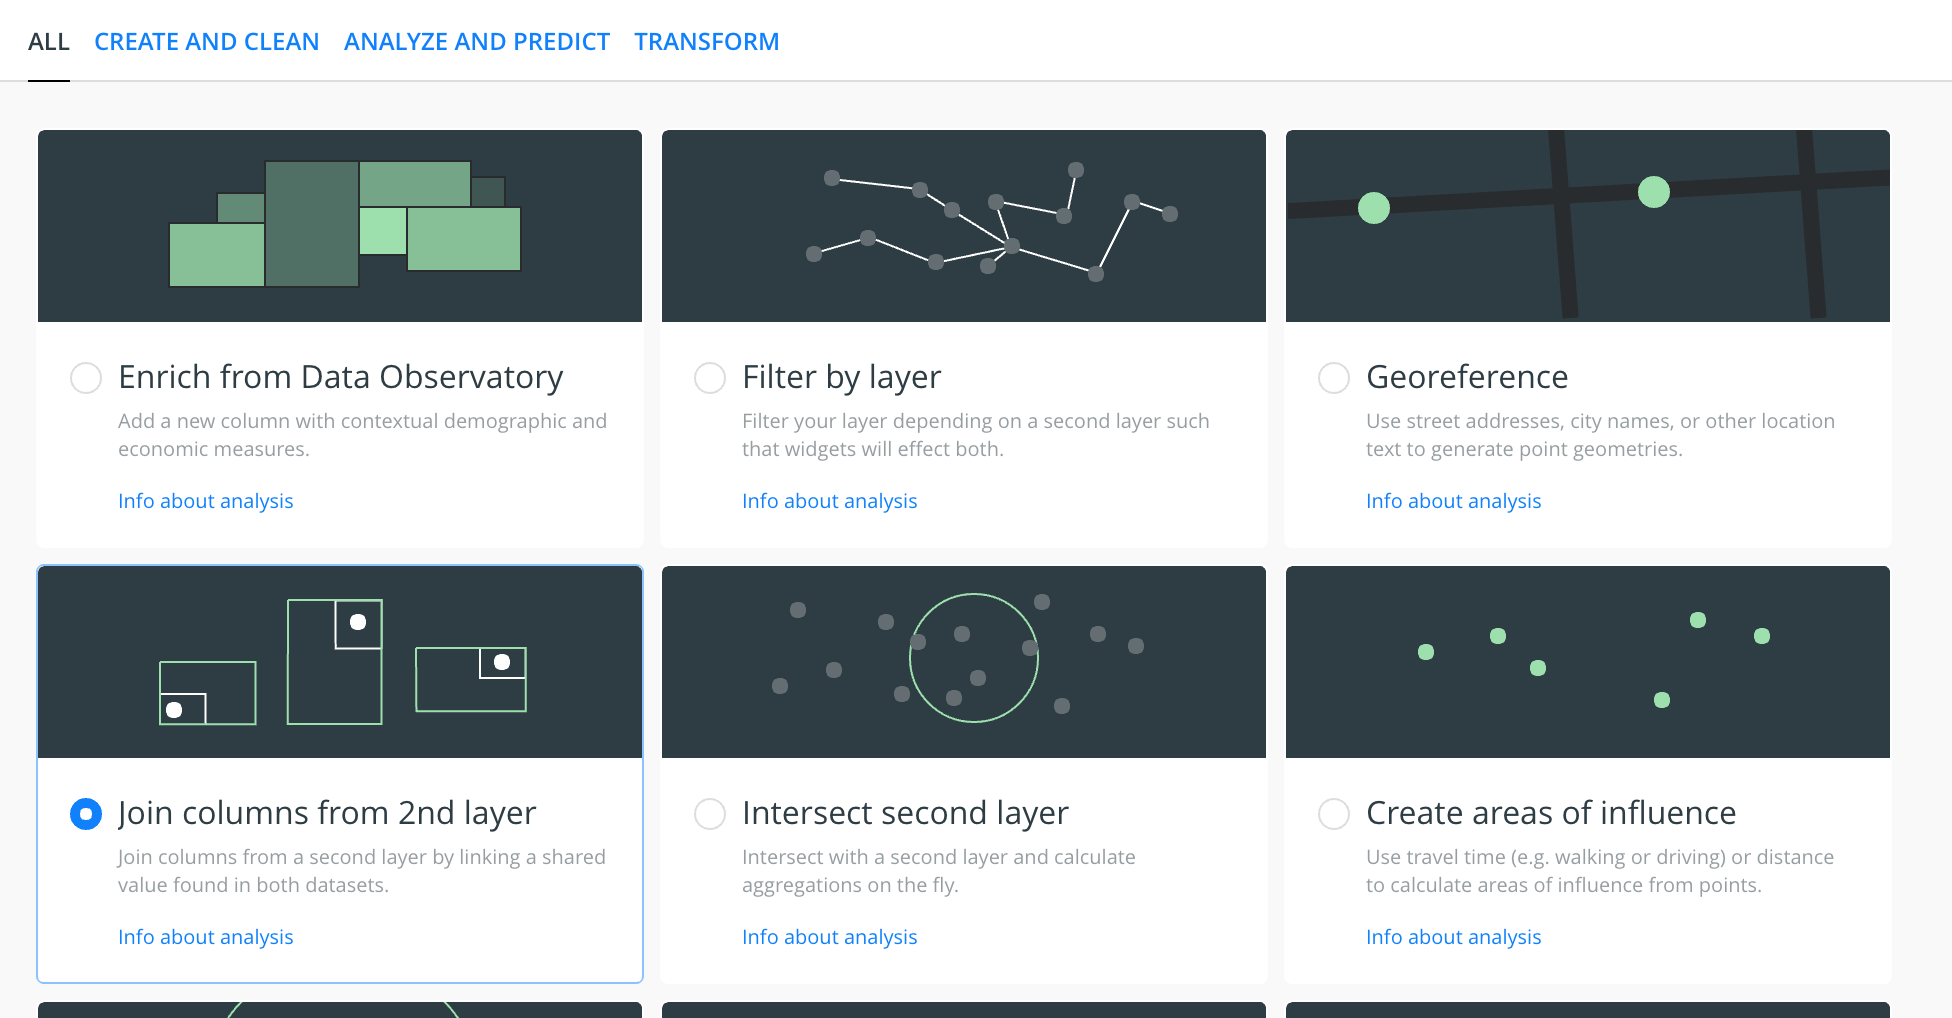
Select the option for Join columns from 2nd layer and click next.
Under 2. Join columns from 2nd layer:
INPUT #1 should be AO Source: townsurvey_polym
and INPUT #2 should be B0 SOURCE: snowfall
These are the two data sets you’re going to join.
Select JOIN TYPE Left.
You could also select Inner, but for this example, let’s use Left.
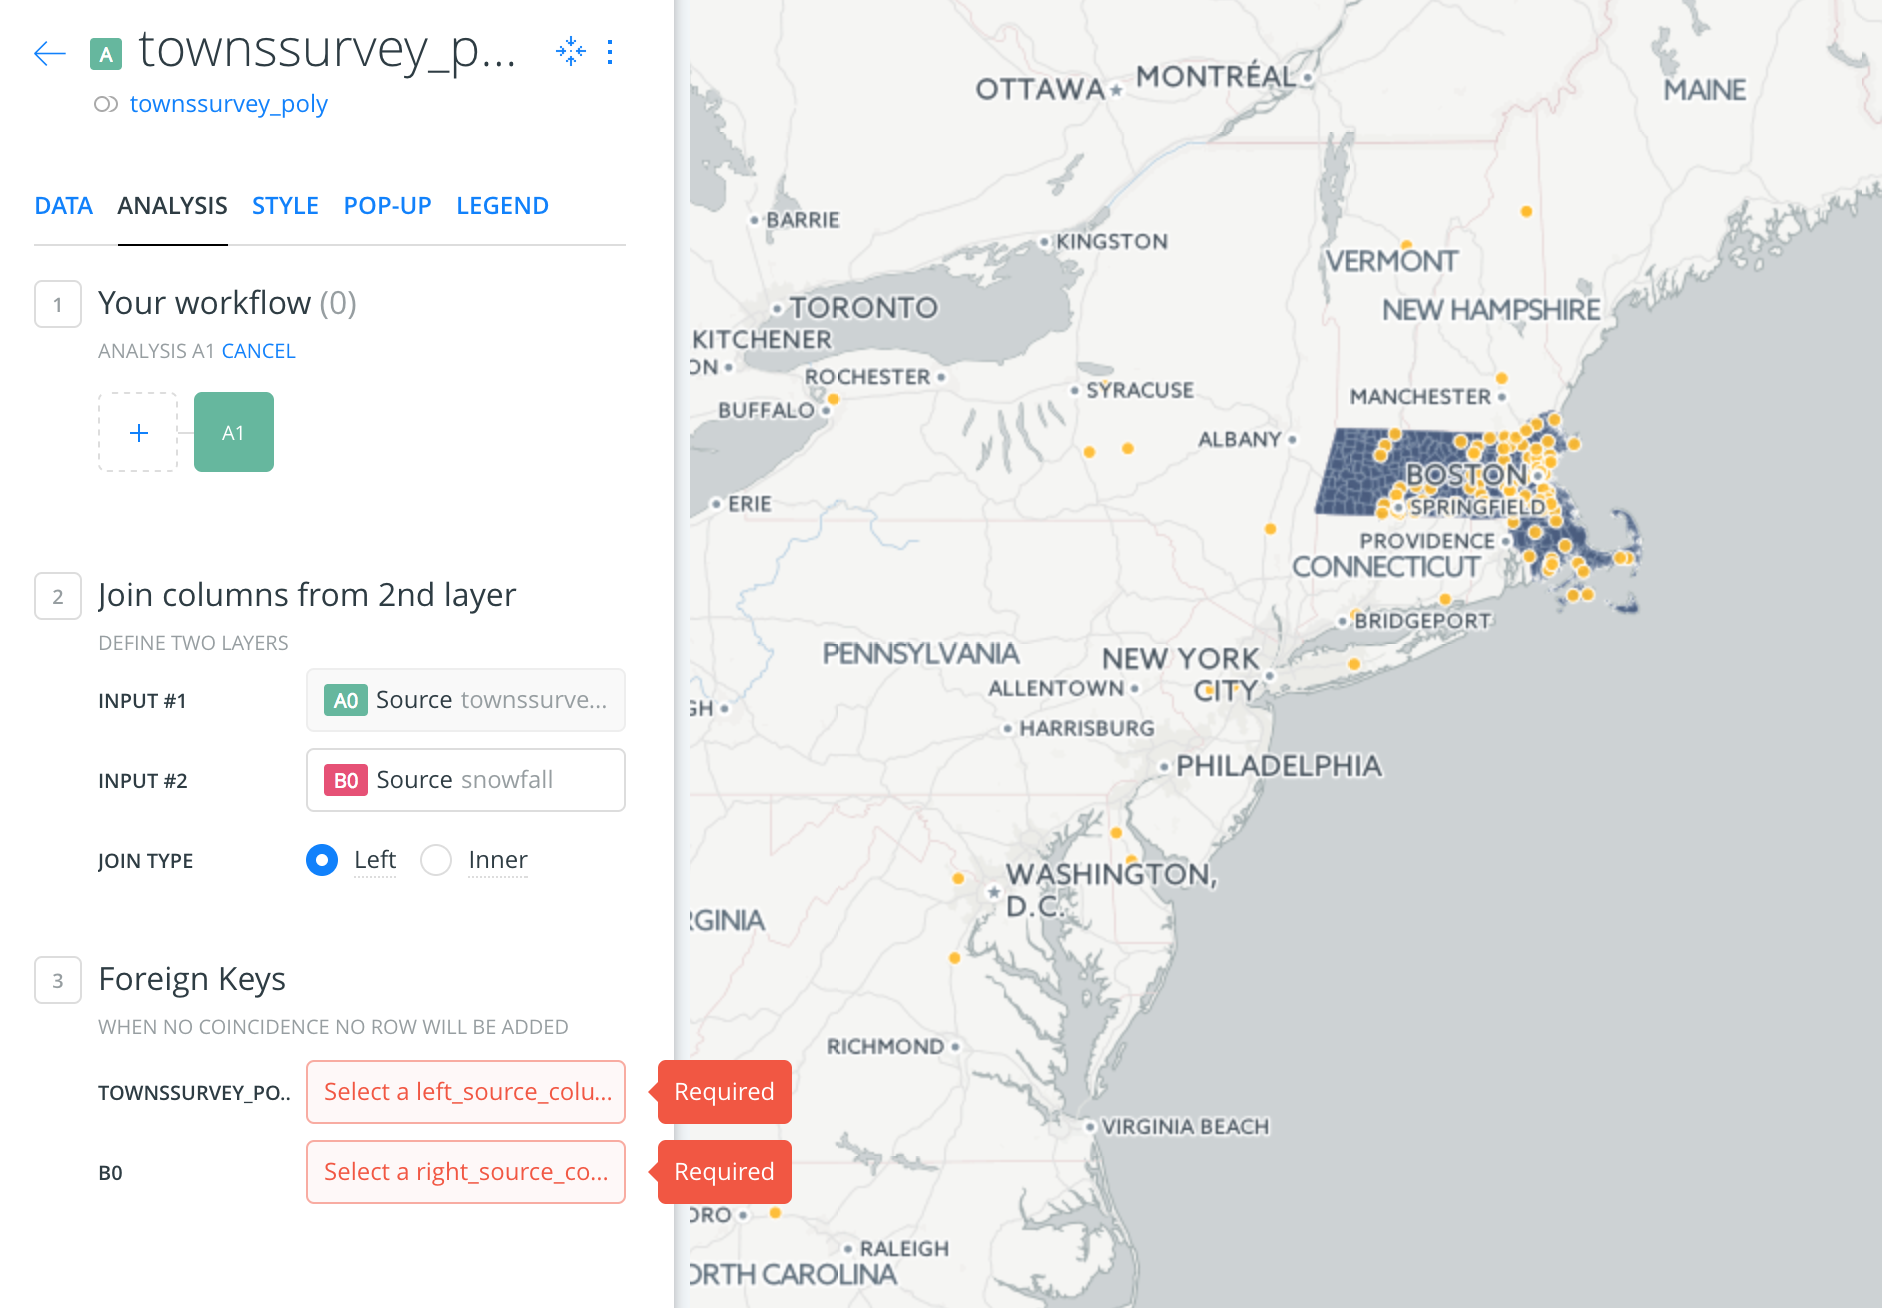
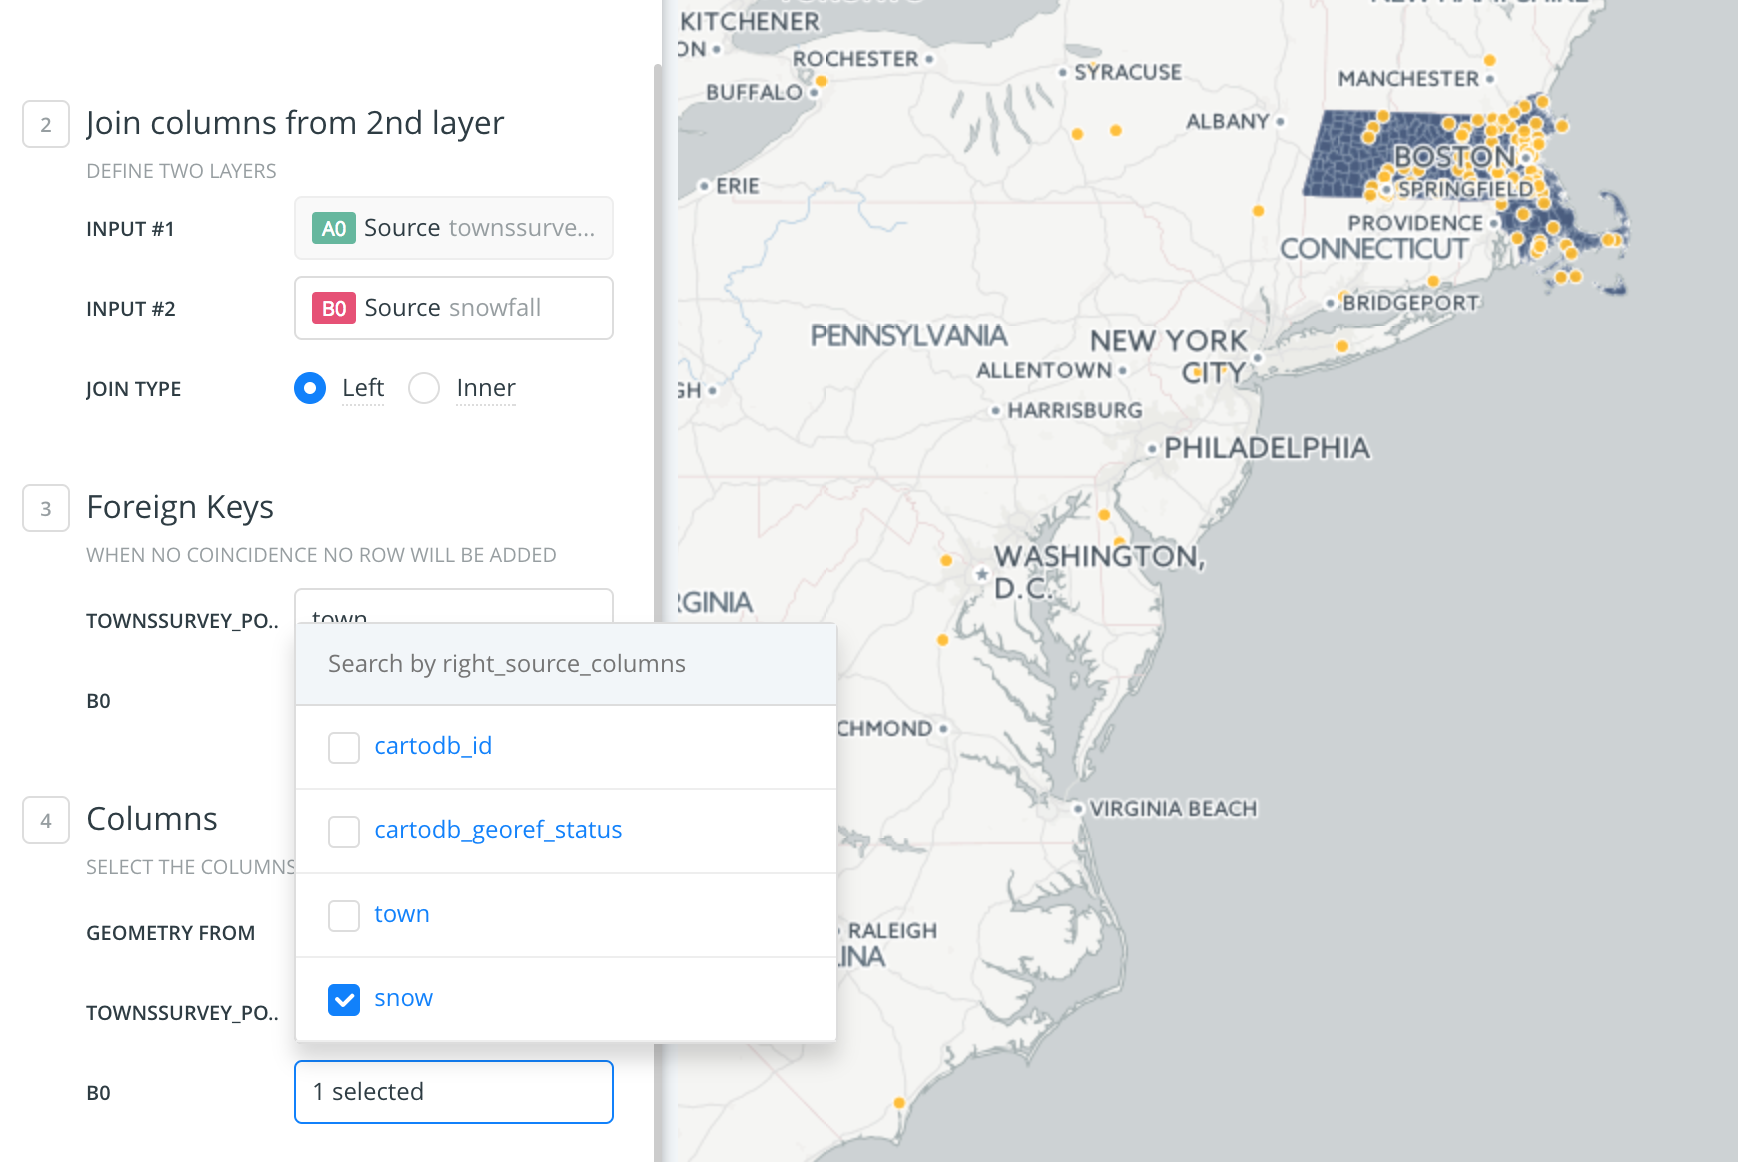
Select the columns to join on in 3. Foreign Keys.
Which columns have the town names in them? For both data sets, the columns are coincidentally called town. Be sure to select those.
Now, in 4. Columns select which columns you want to keep in the new data set.
Definitely pick the snow column next to B0.
We can style it now!
Select BY VALUE in FILL and choose a blue gradient.
But there are all these dots where the towns were geolocated.
Let’s git rid of that.
Go back to the layer and select the eye icon next to snowfall.
This makes that layer invisible.
Now you’ve got a clean map.
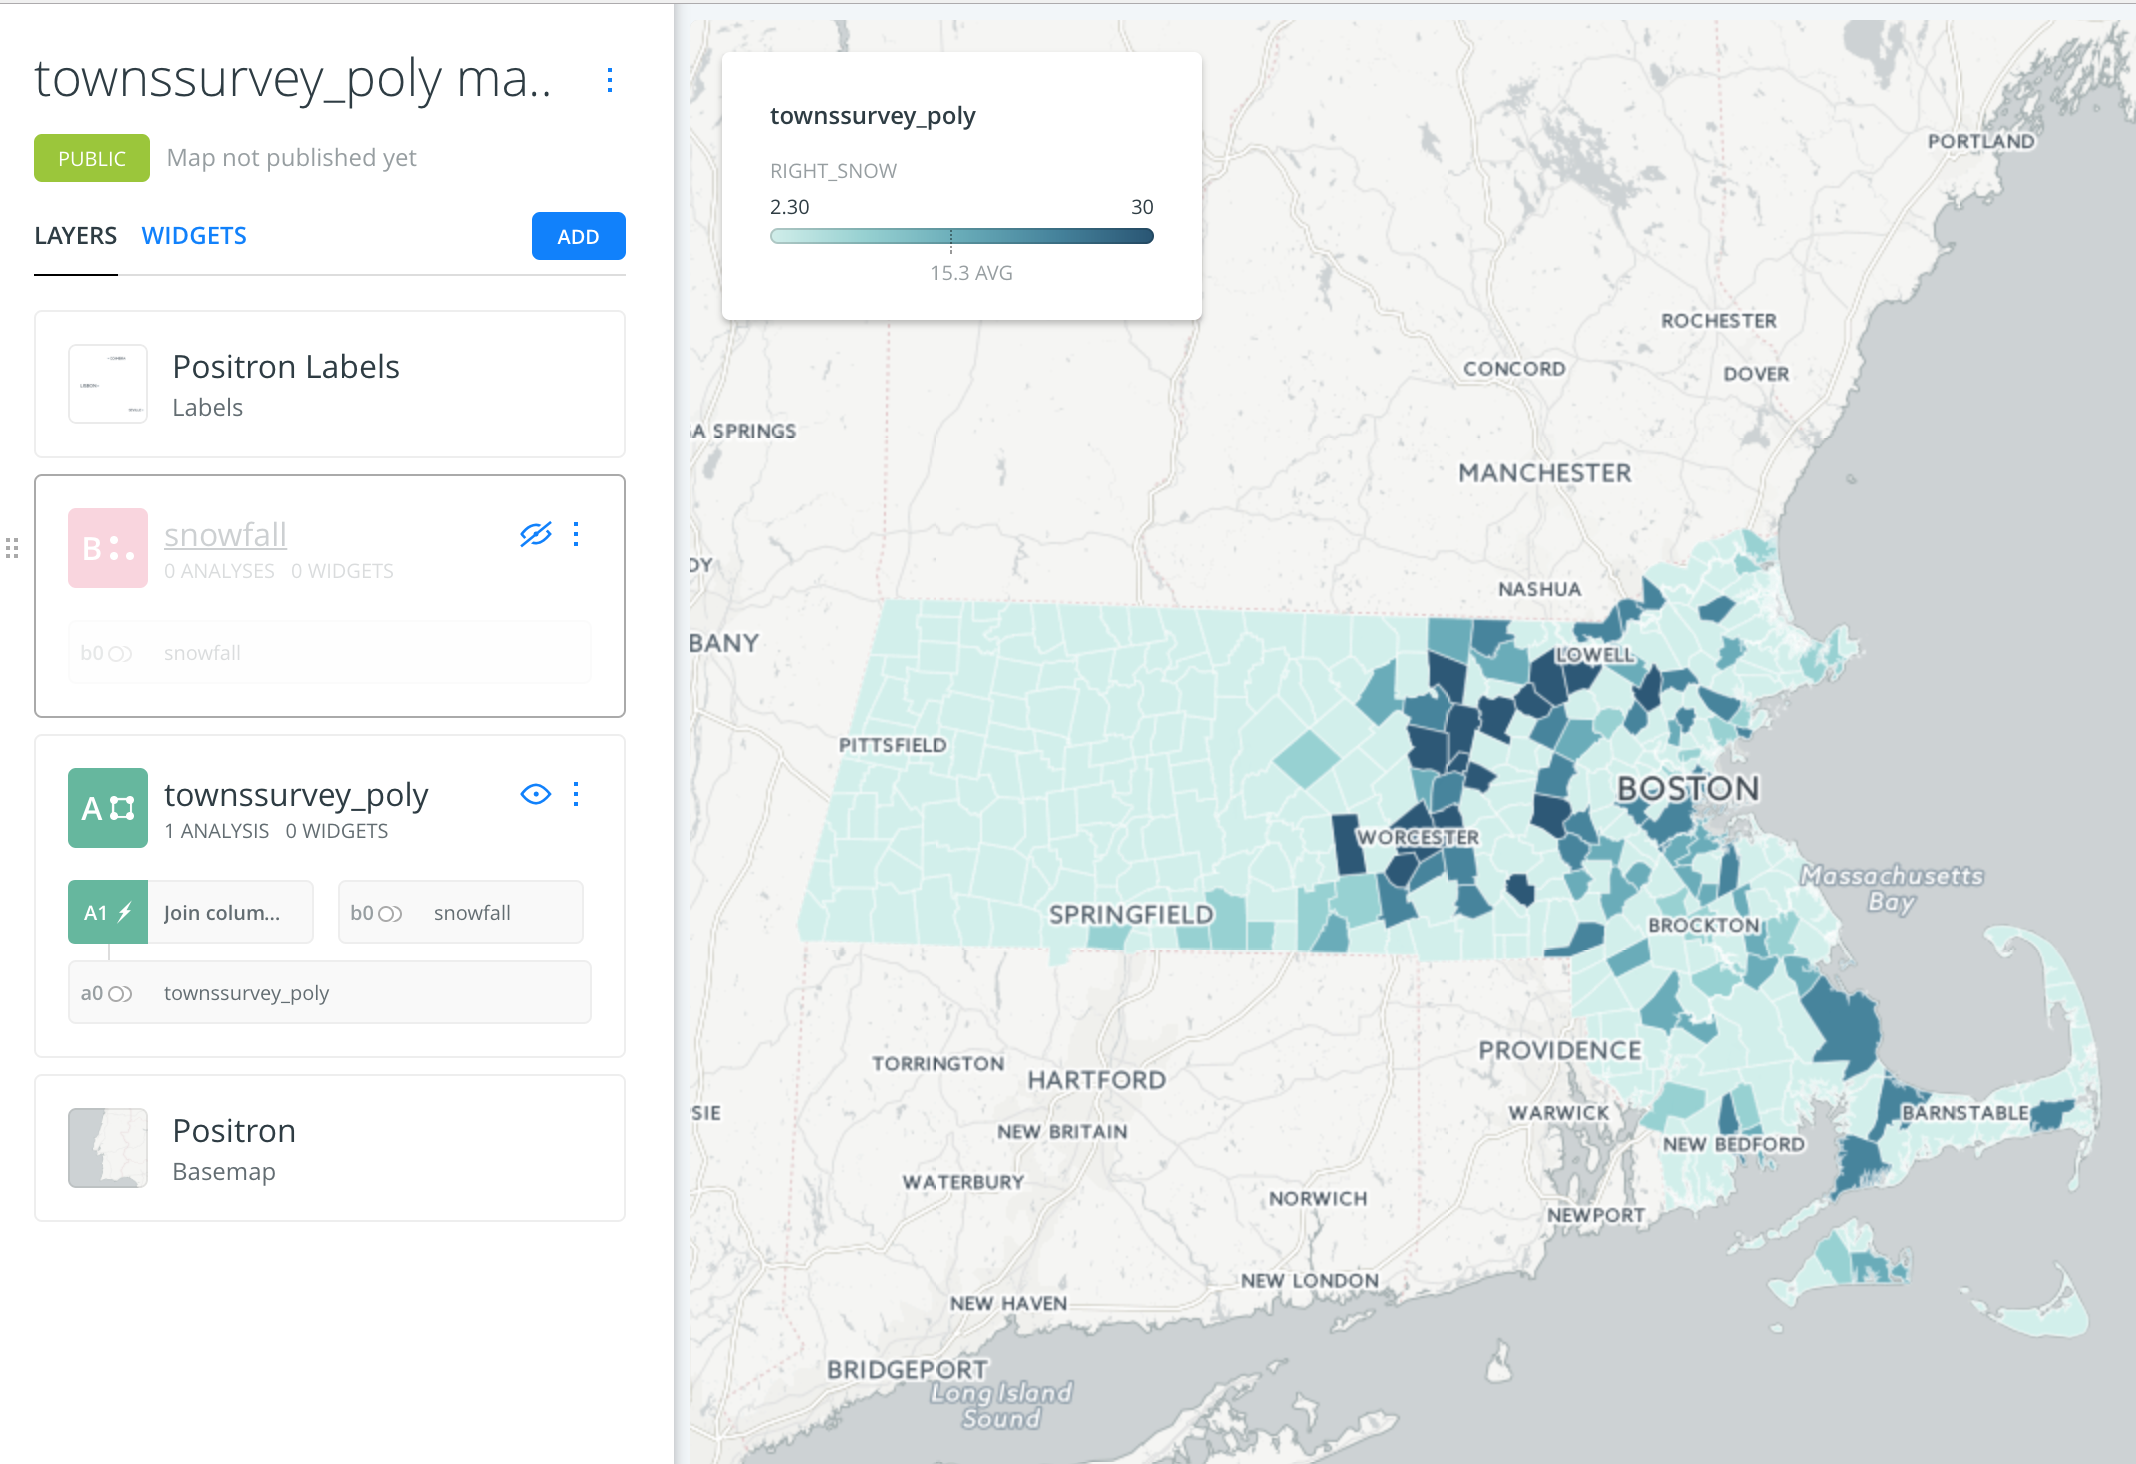
Well, almost.
There’s that light blue out west and scattered across the state.
Those represent the null values. Or the states where there were no data to be joined.
When we did the original join, if we used Inner Join as an option instead of Left Join this problem would’ve been solved.
But we’re going to try to filter it out ourselves.
This involevs going back into the townssurvey_poly layer and adding another level of analysis.
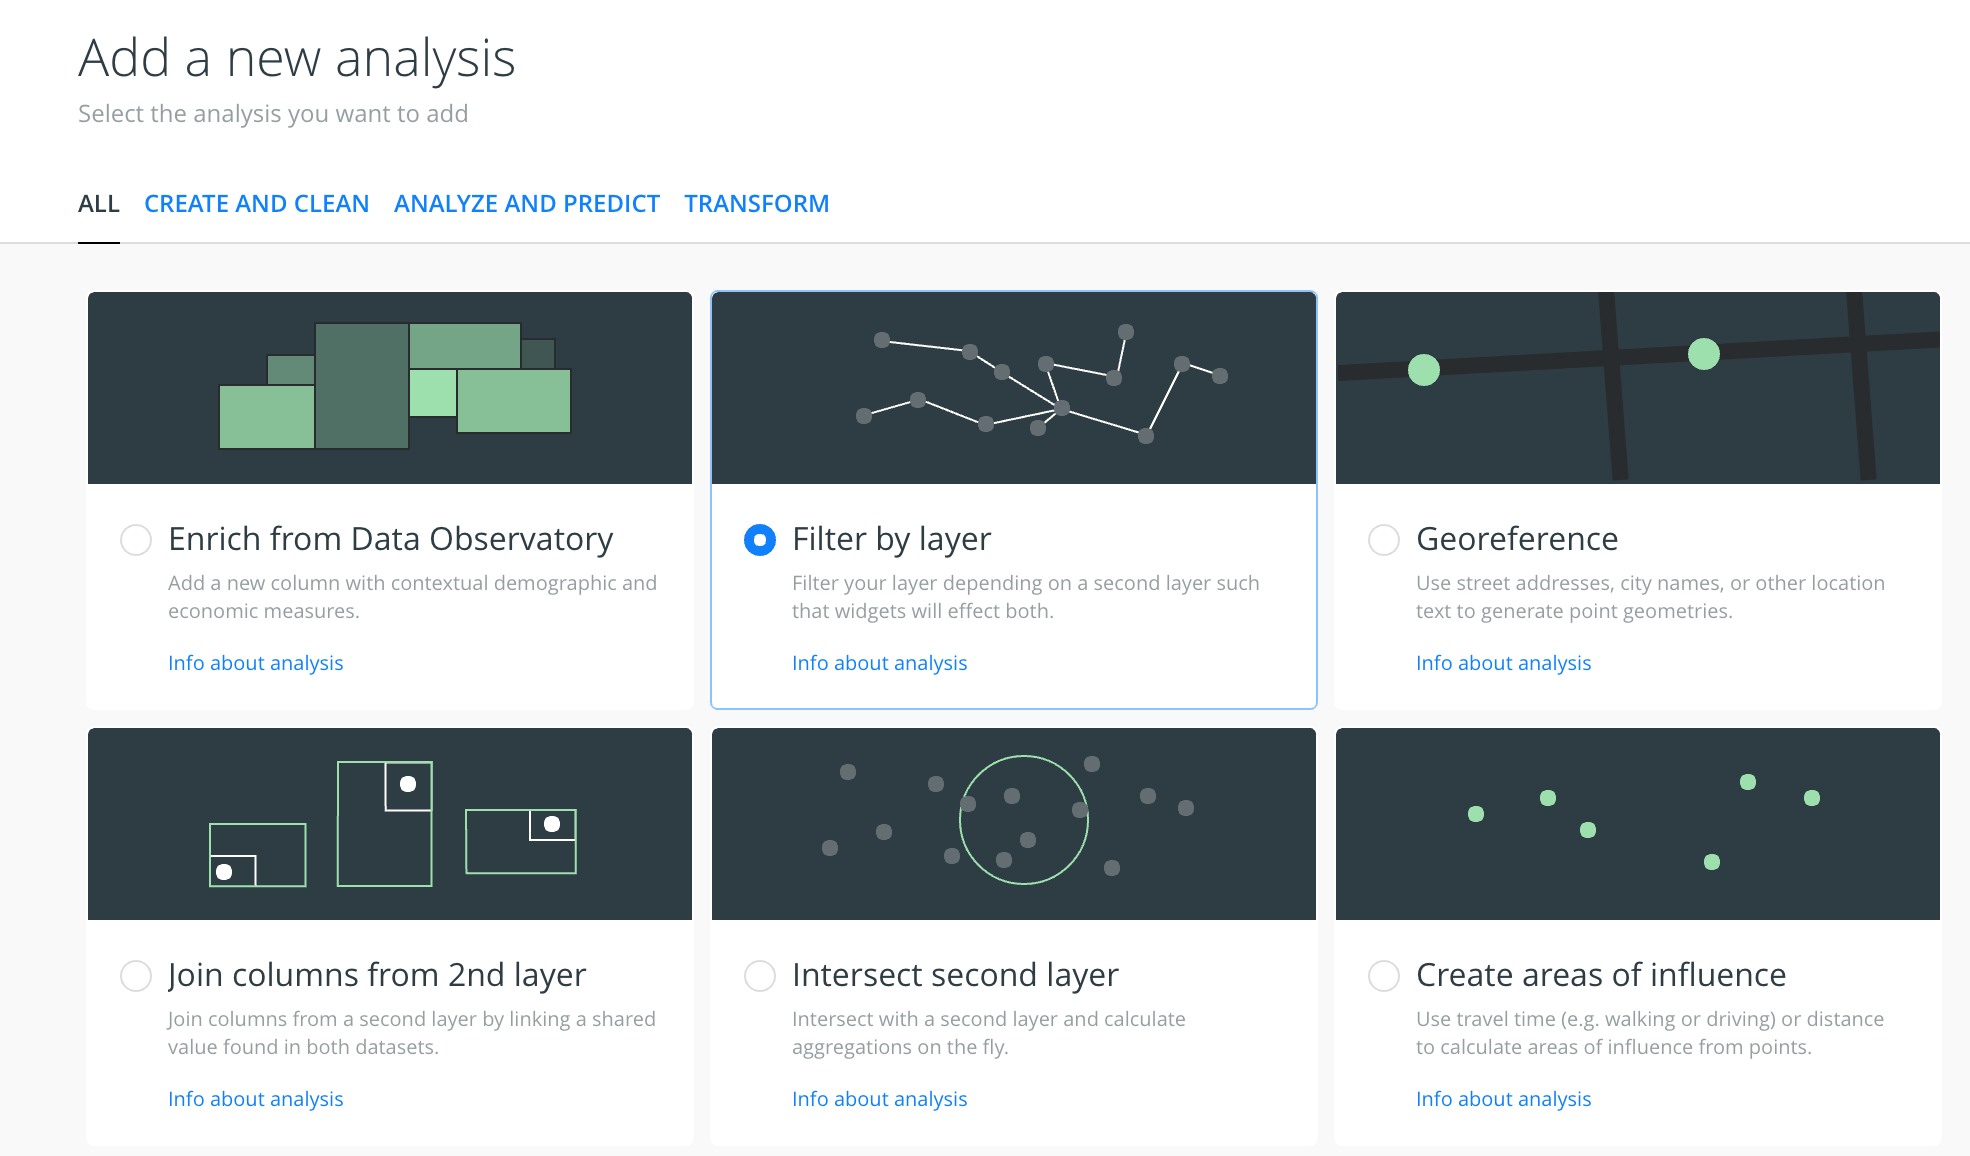
Click on Add a new analysis.
This time select filter by layer.
In 2. Filter by layer make sure FILTER BY LAYER has B0 Source: snowfall selected.
Then in 3. Key columns select right_snow in SOURCE COLUMN and snow in FILTER COLUMN.
You’ll get this:
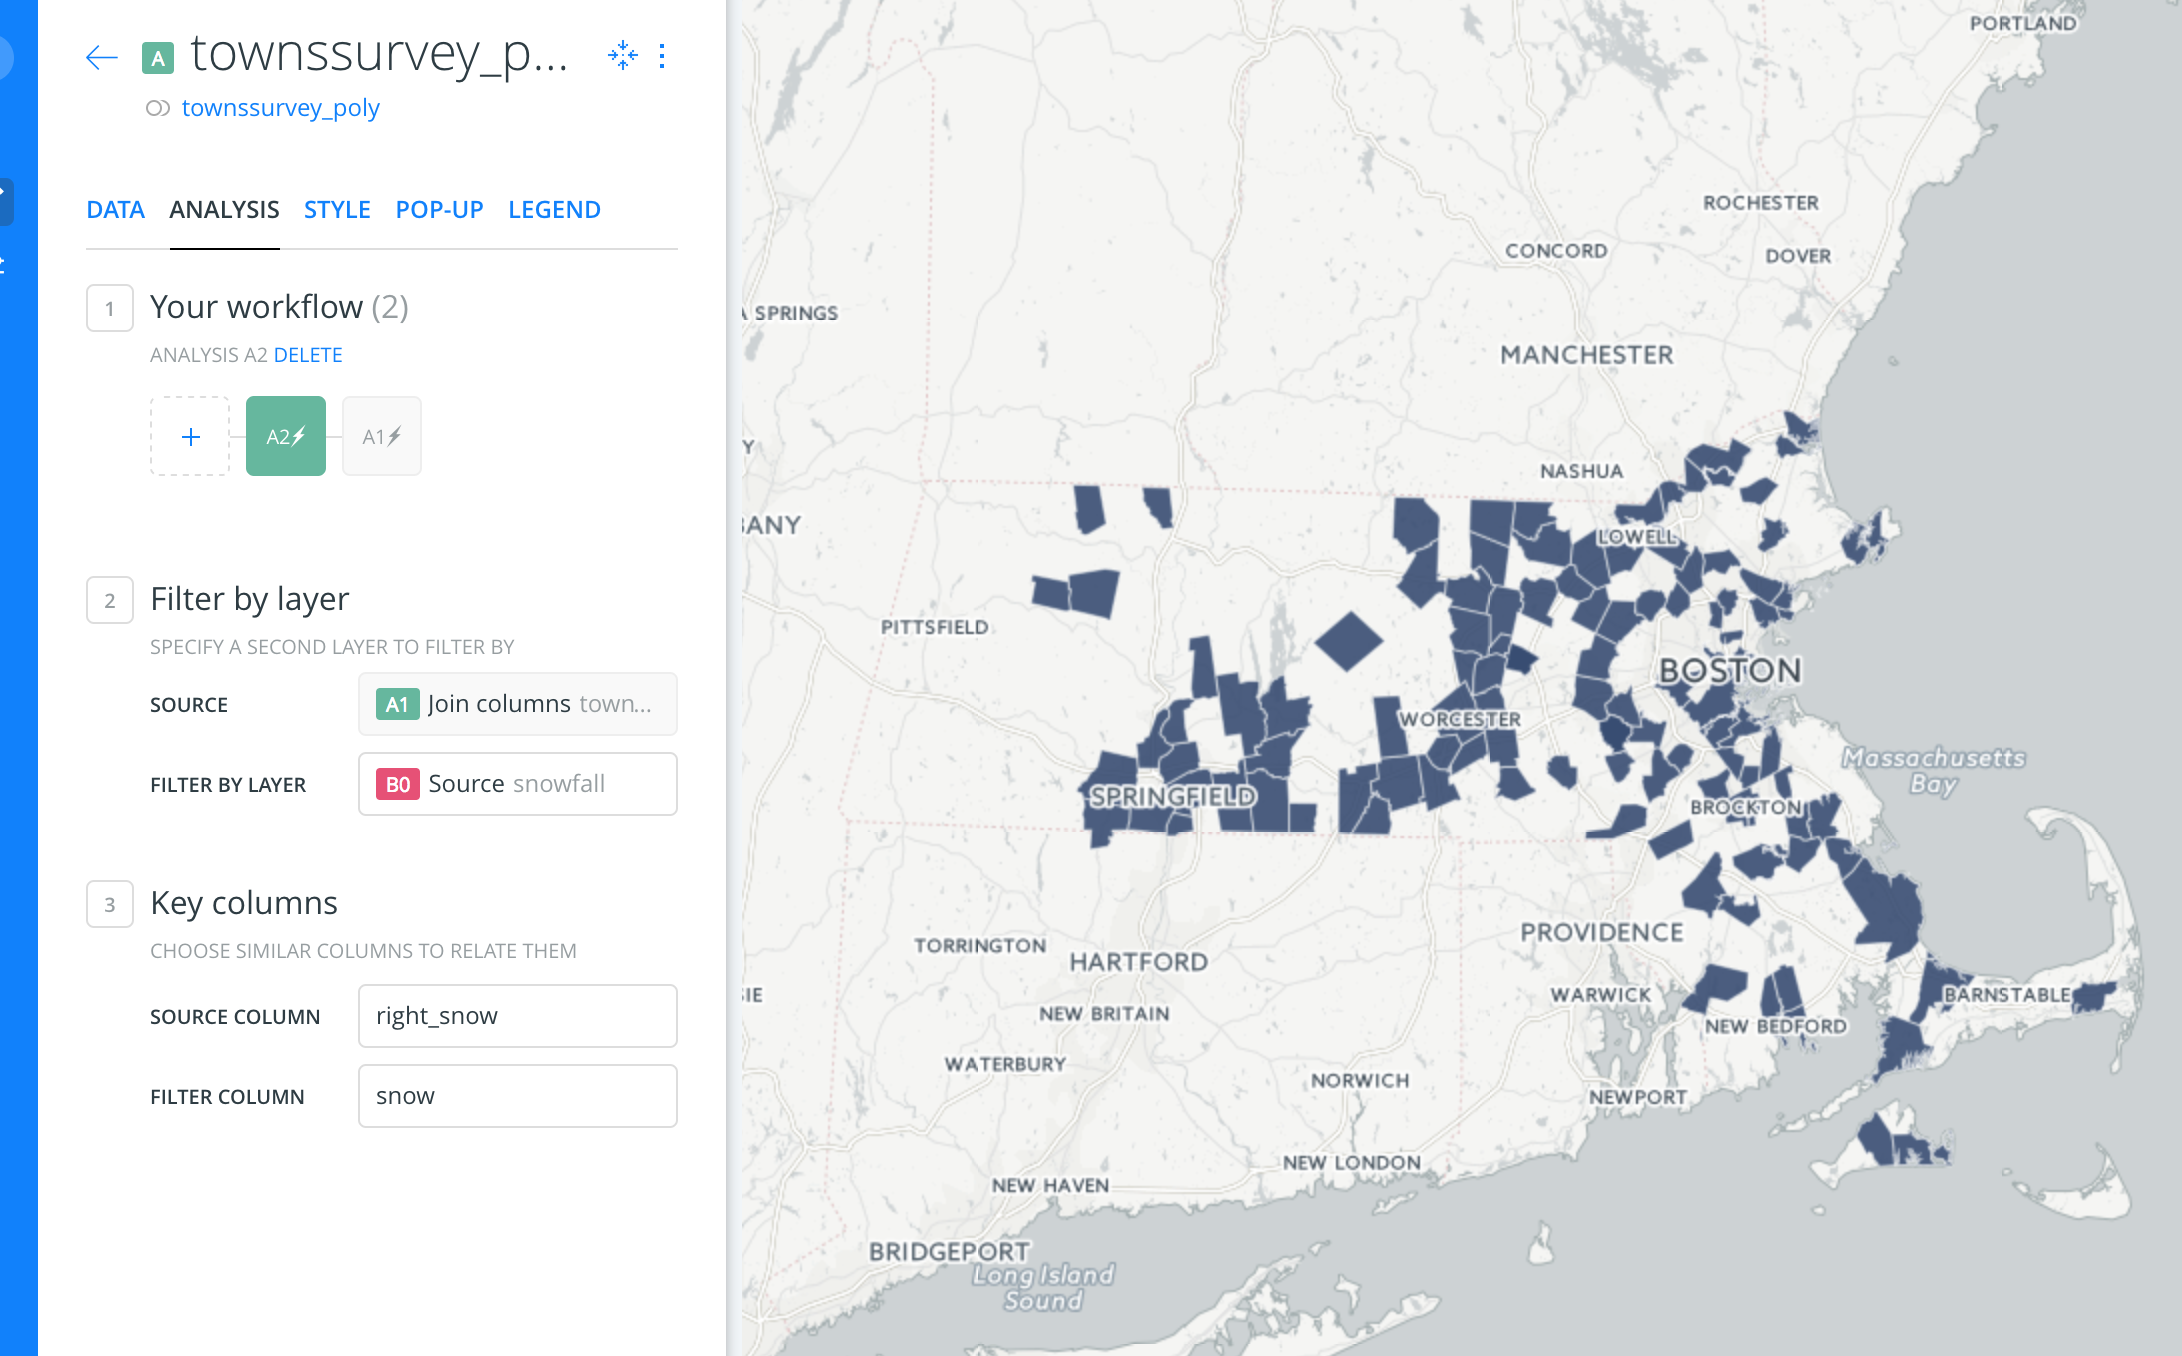
Now the towns with no data joined to it just disappear.
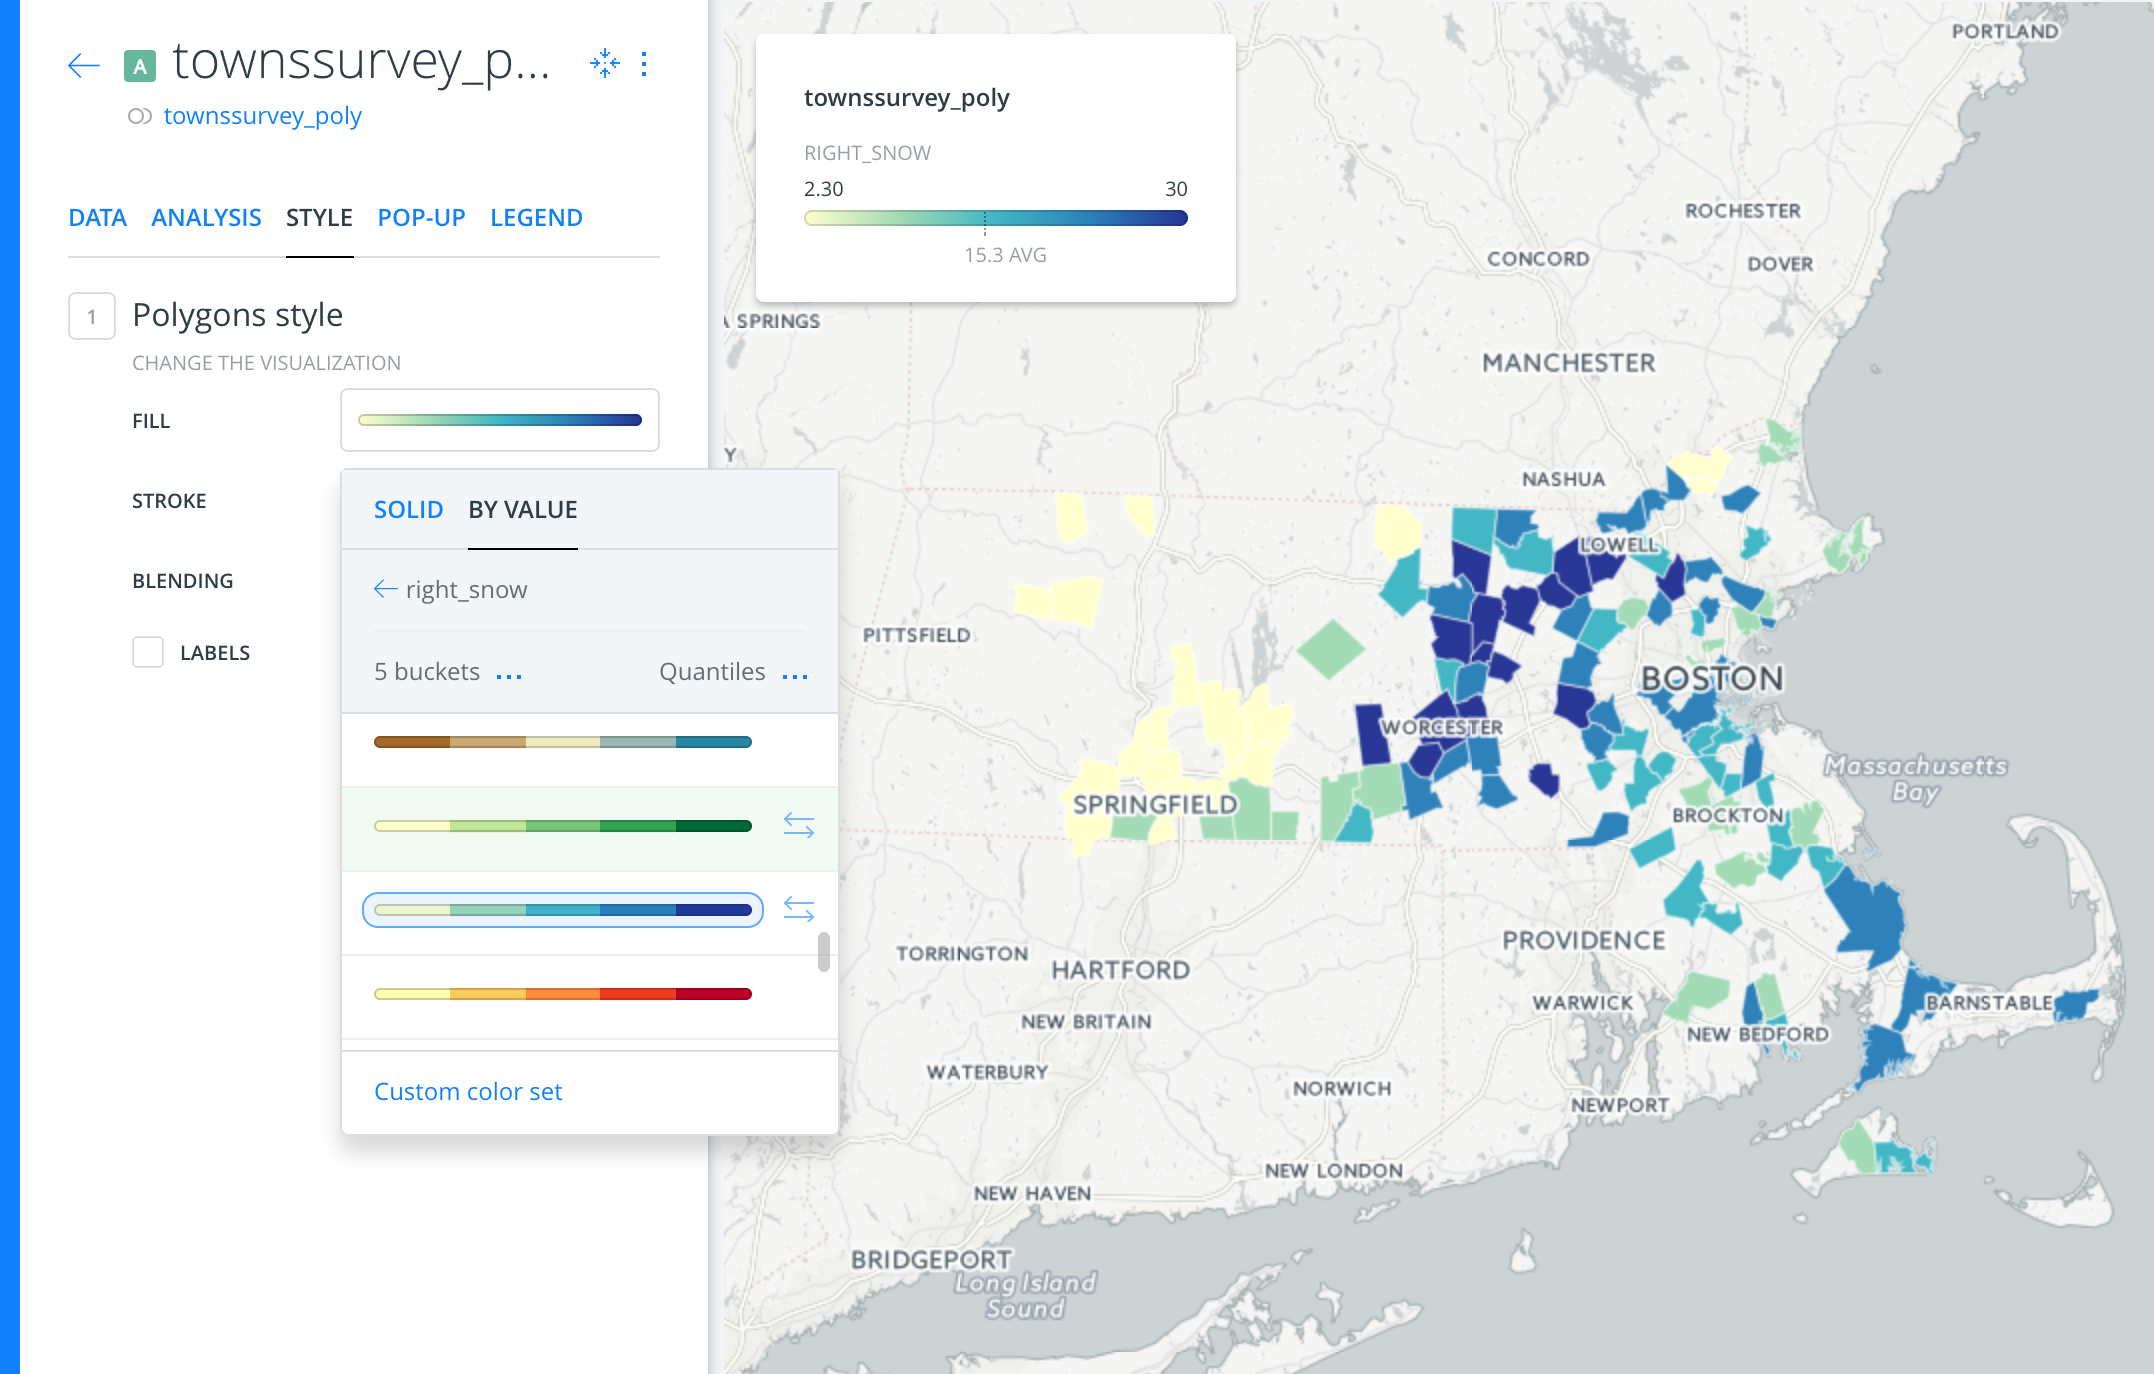
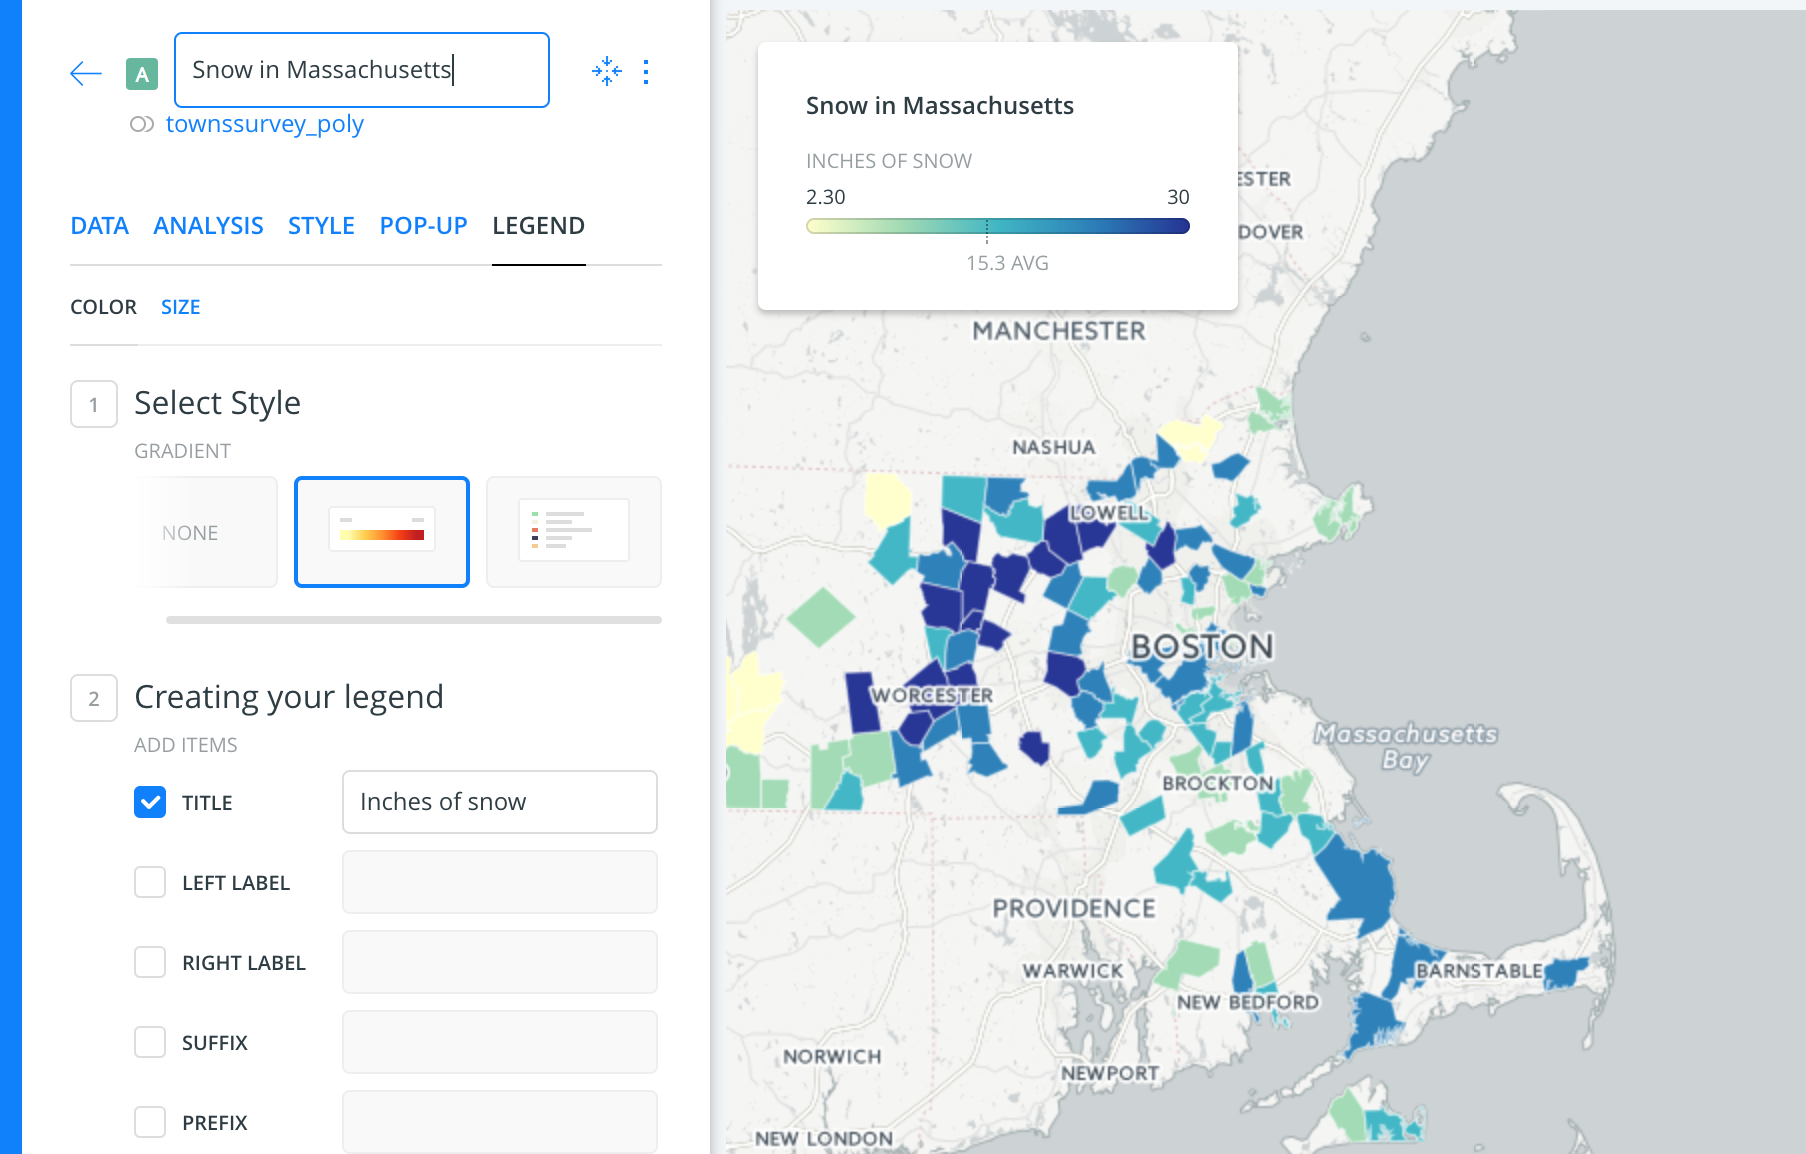
Let’s restyle it BY VALUE.
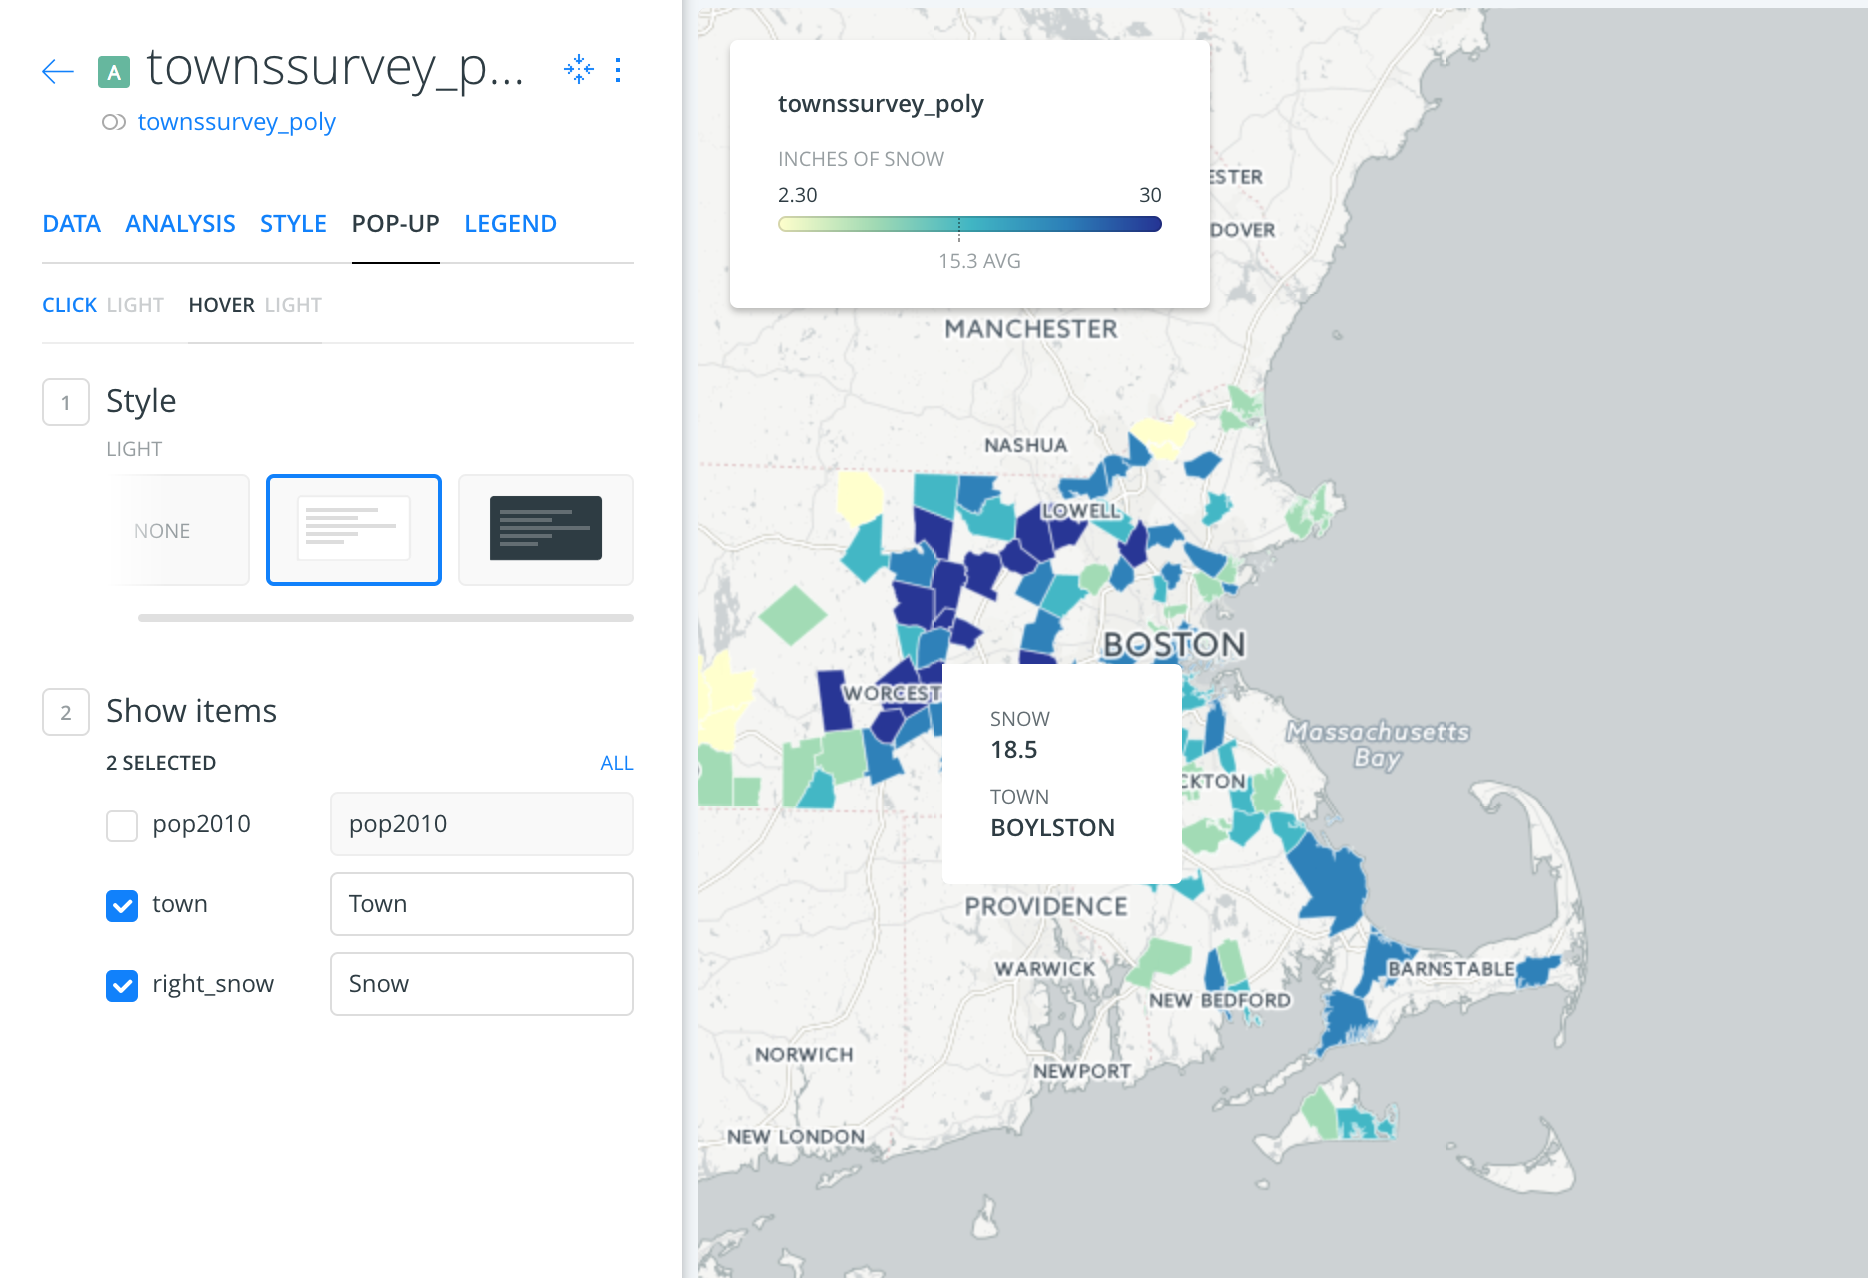
Now let’s add some popups and clean up the titles.
That means changing town to Town and right_snow to Snow.
Let’s also change the name of the map from the default townssurvey_poly to “Snow in Massachusetts” by selecting into the text at the very top.
And then, finally, click on share and Public.
You now have the direct link or can get the embed code to put into a website.
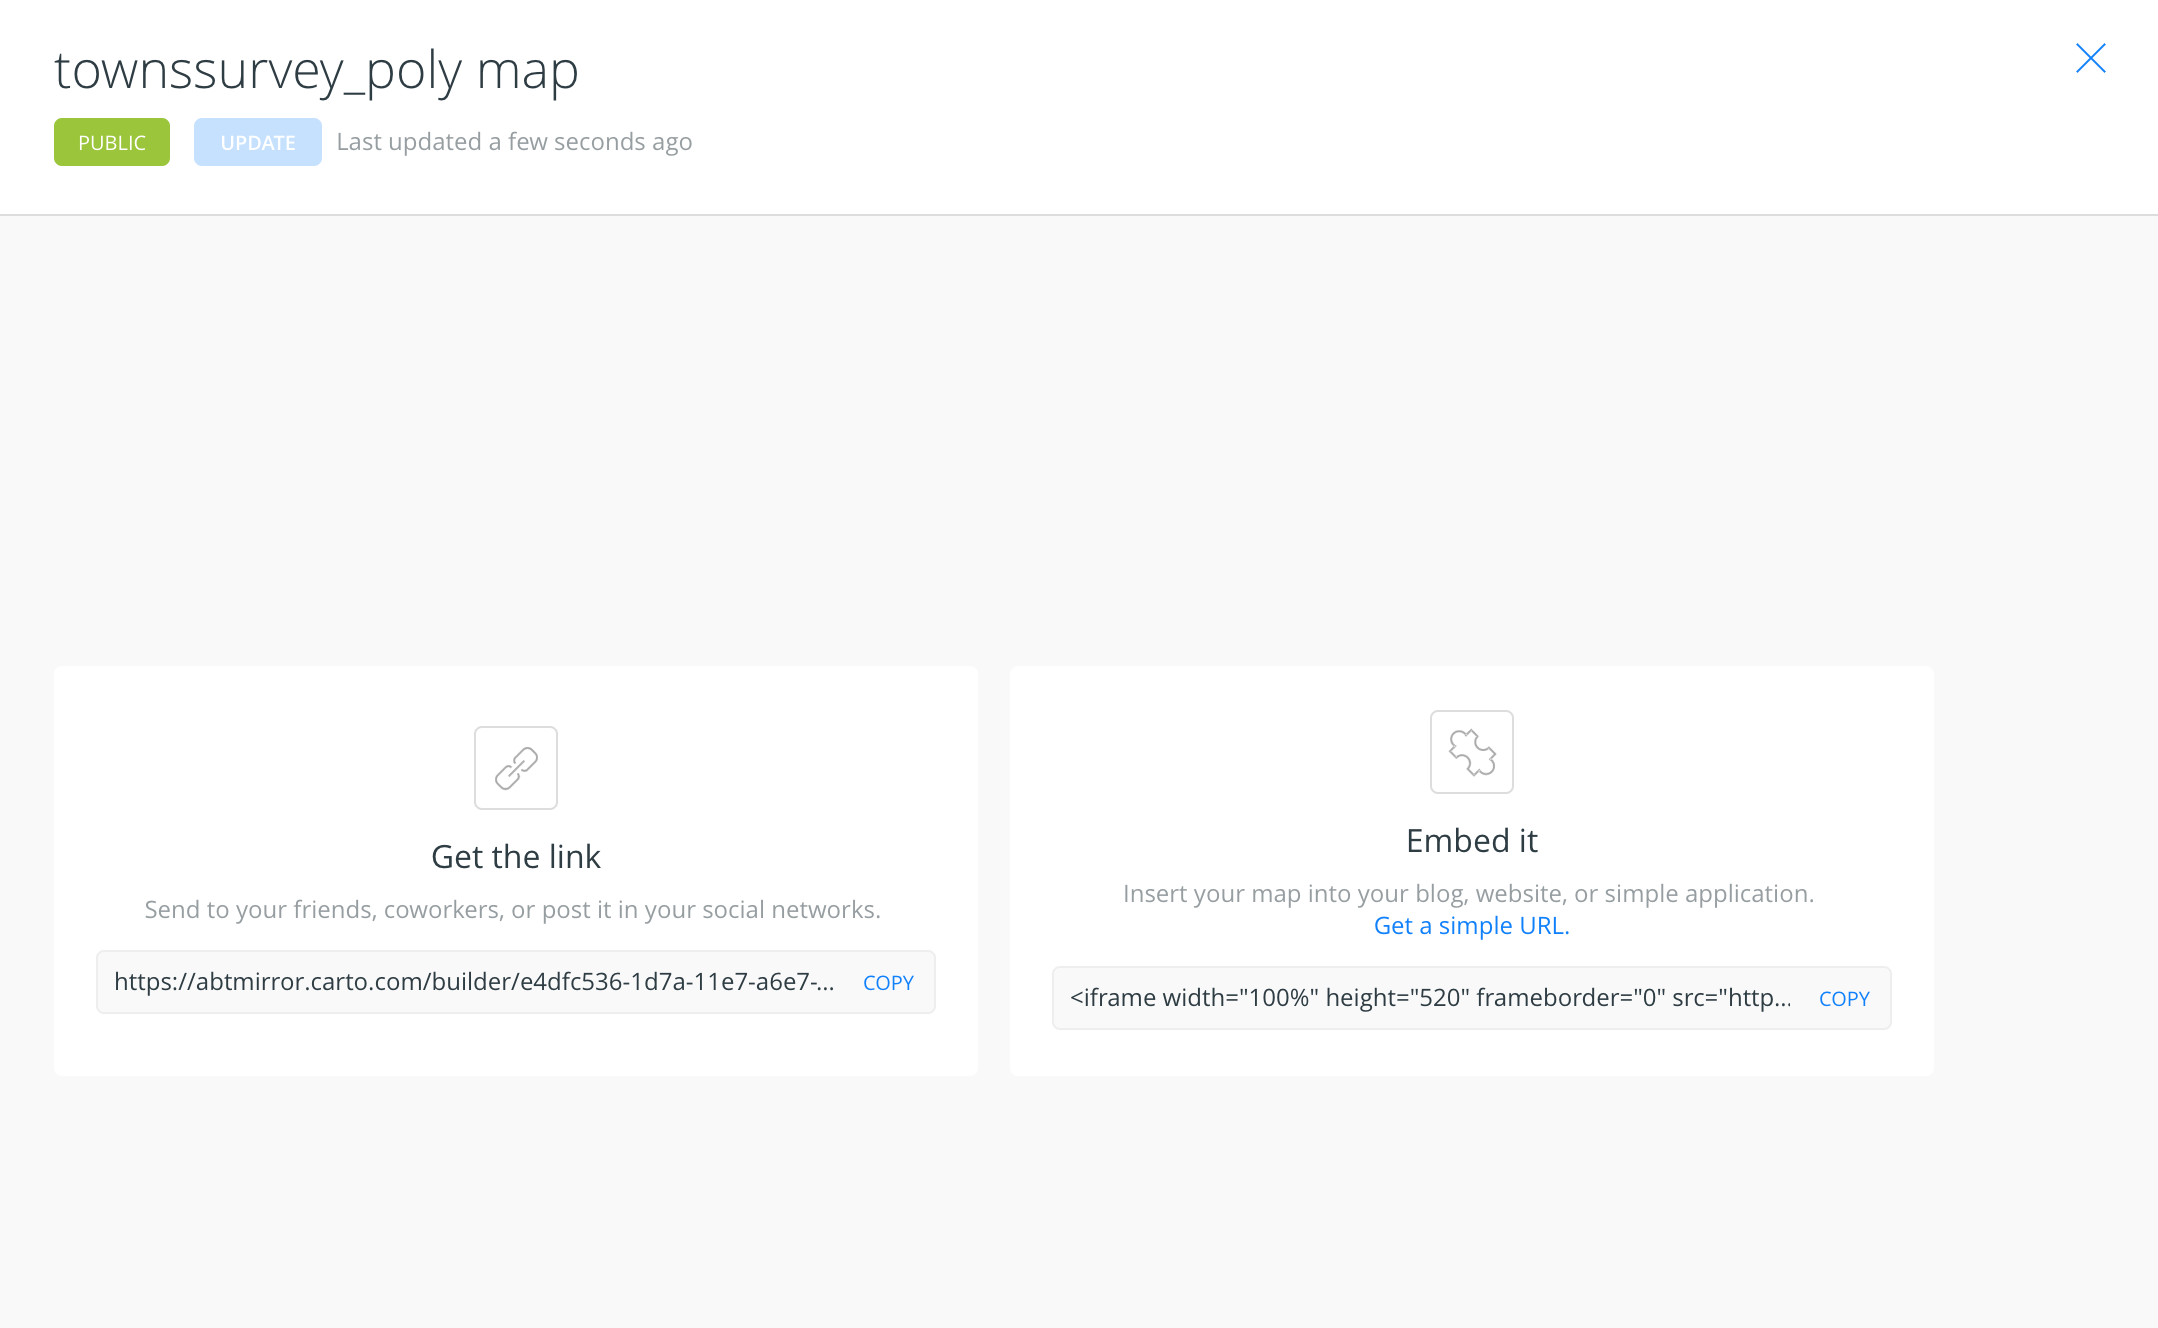
Congratulations! You’ve made a choropleth map.