Introduction to Google Sheets
Starting out
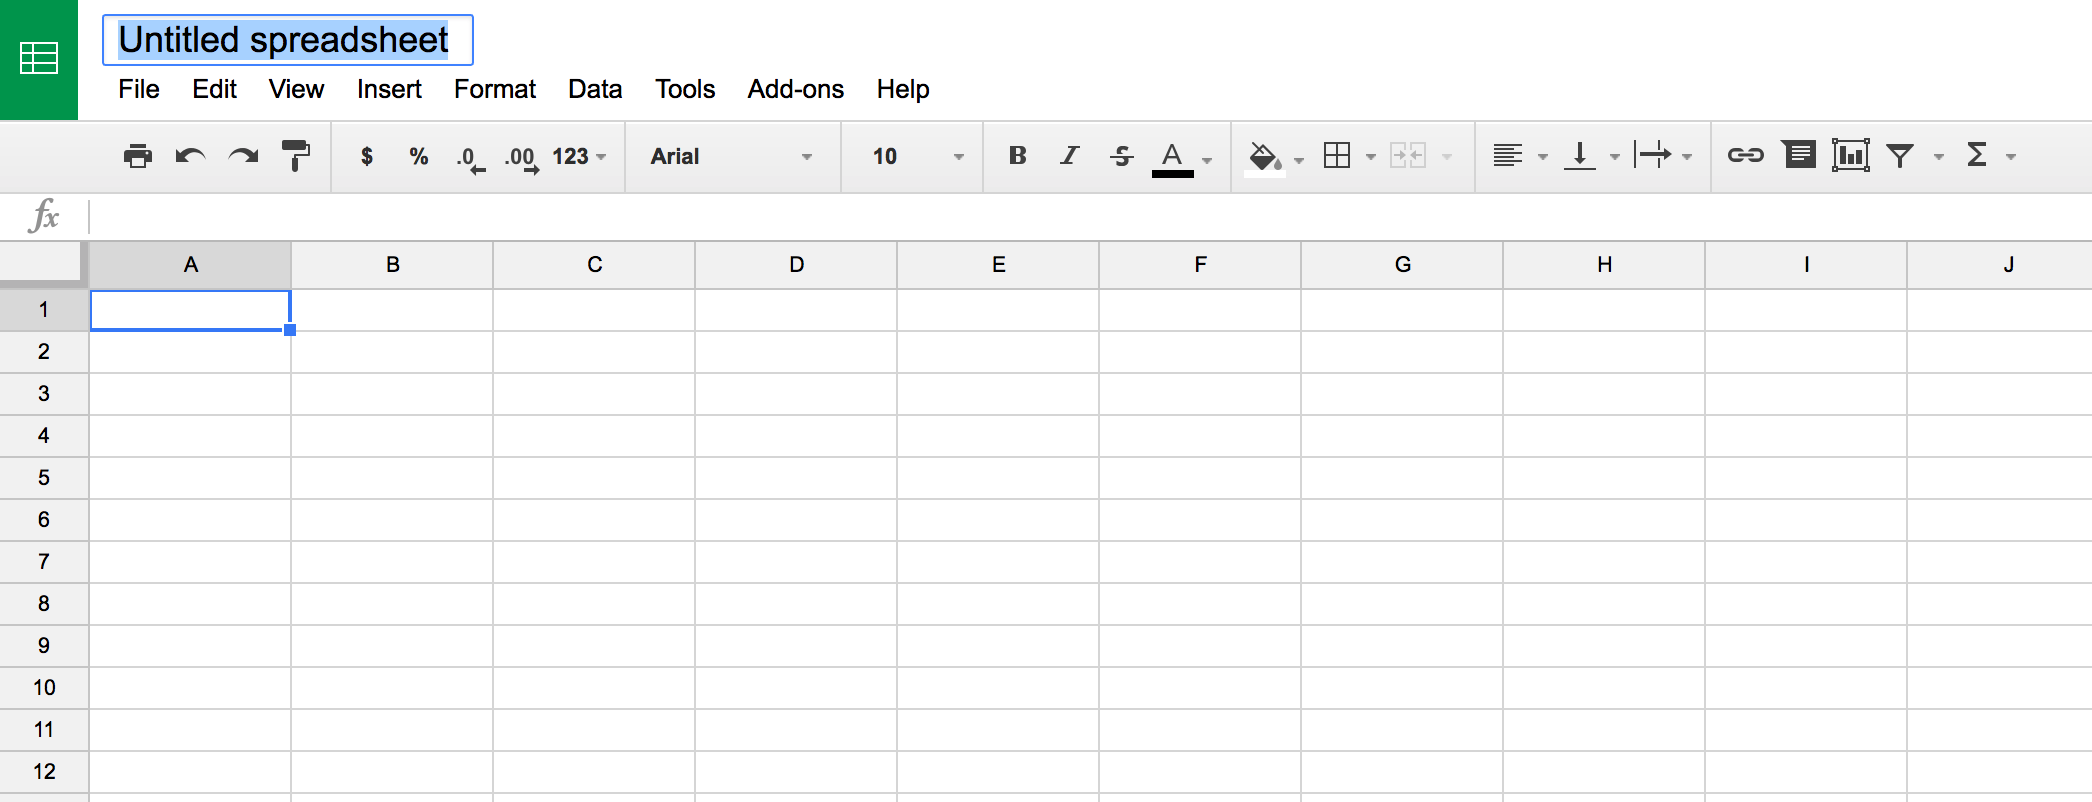
Creat a new sheet in your Google Drive account– in the JRN-418 Homework folder to keep things organized.
Change Untitled spreadsheet to whatever name you want to remember your sheet by.
The structure
Spreadsheets are made of grids. These grids are made up of individual cells.
We’ve got columns and rows of data.
Think of columns like pillars of a building that go up and down.
Rows are like seats in a theater that go from left to right.
Selecting data
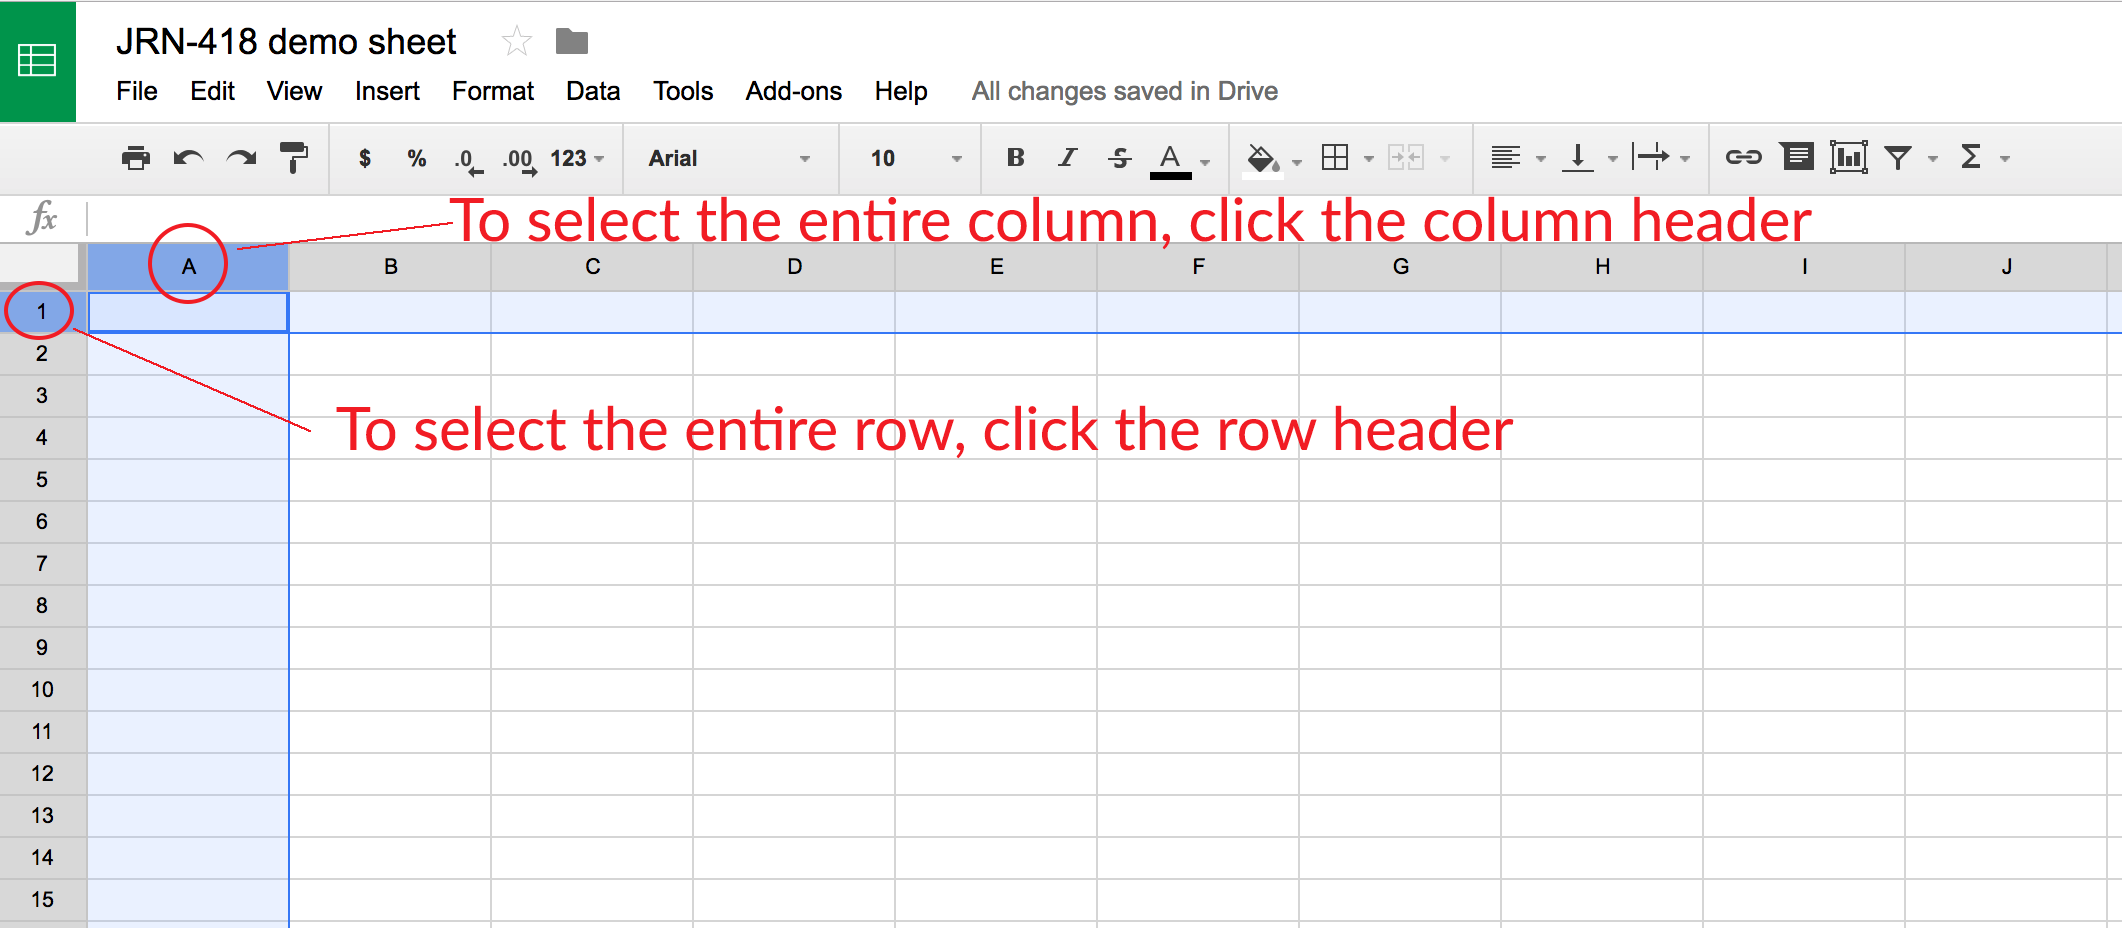
You can select the data in the entire row by selecting the row number on the far left.
Likewise, you can select the entire column of data by selecting the column letter.
Adjusting column widths
For better readability, you can resize column widths by dragging the line between columns left and right.
Or by selecting a single column head and double clicking the line between column headers. This resizes the column to fit the widest data point in that column.
OR! Just click that square where the row and column headers meet (this selects all the cells in the sheet) and then double click just one line between a pair of columns. This will apply the resizing to all of the columns now.
Importing data
Have you downloaded this data set to your computer yet?
Let’s bring it into Google Sheets so we can analyze it.
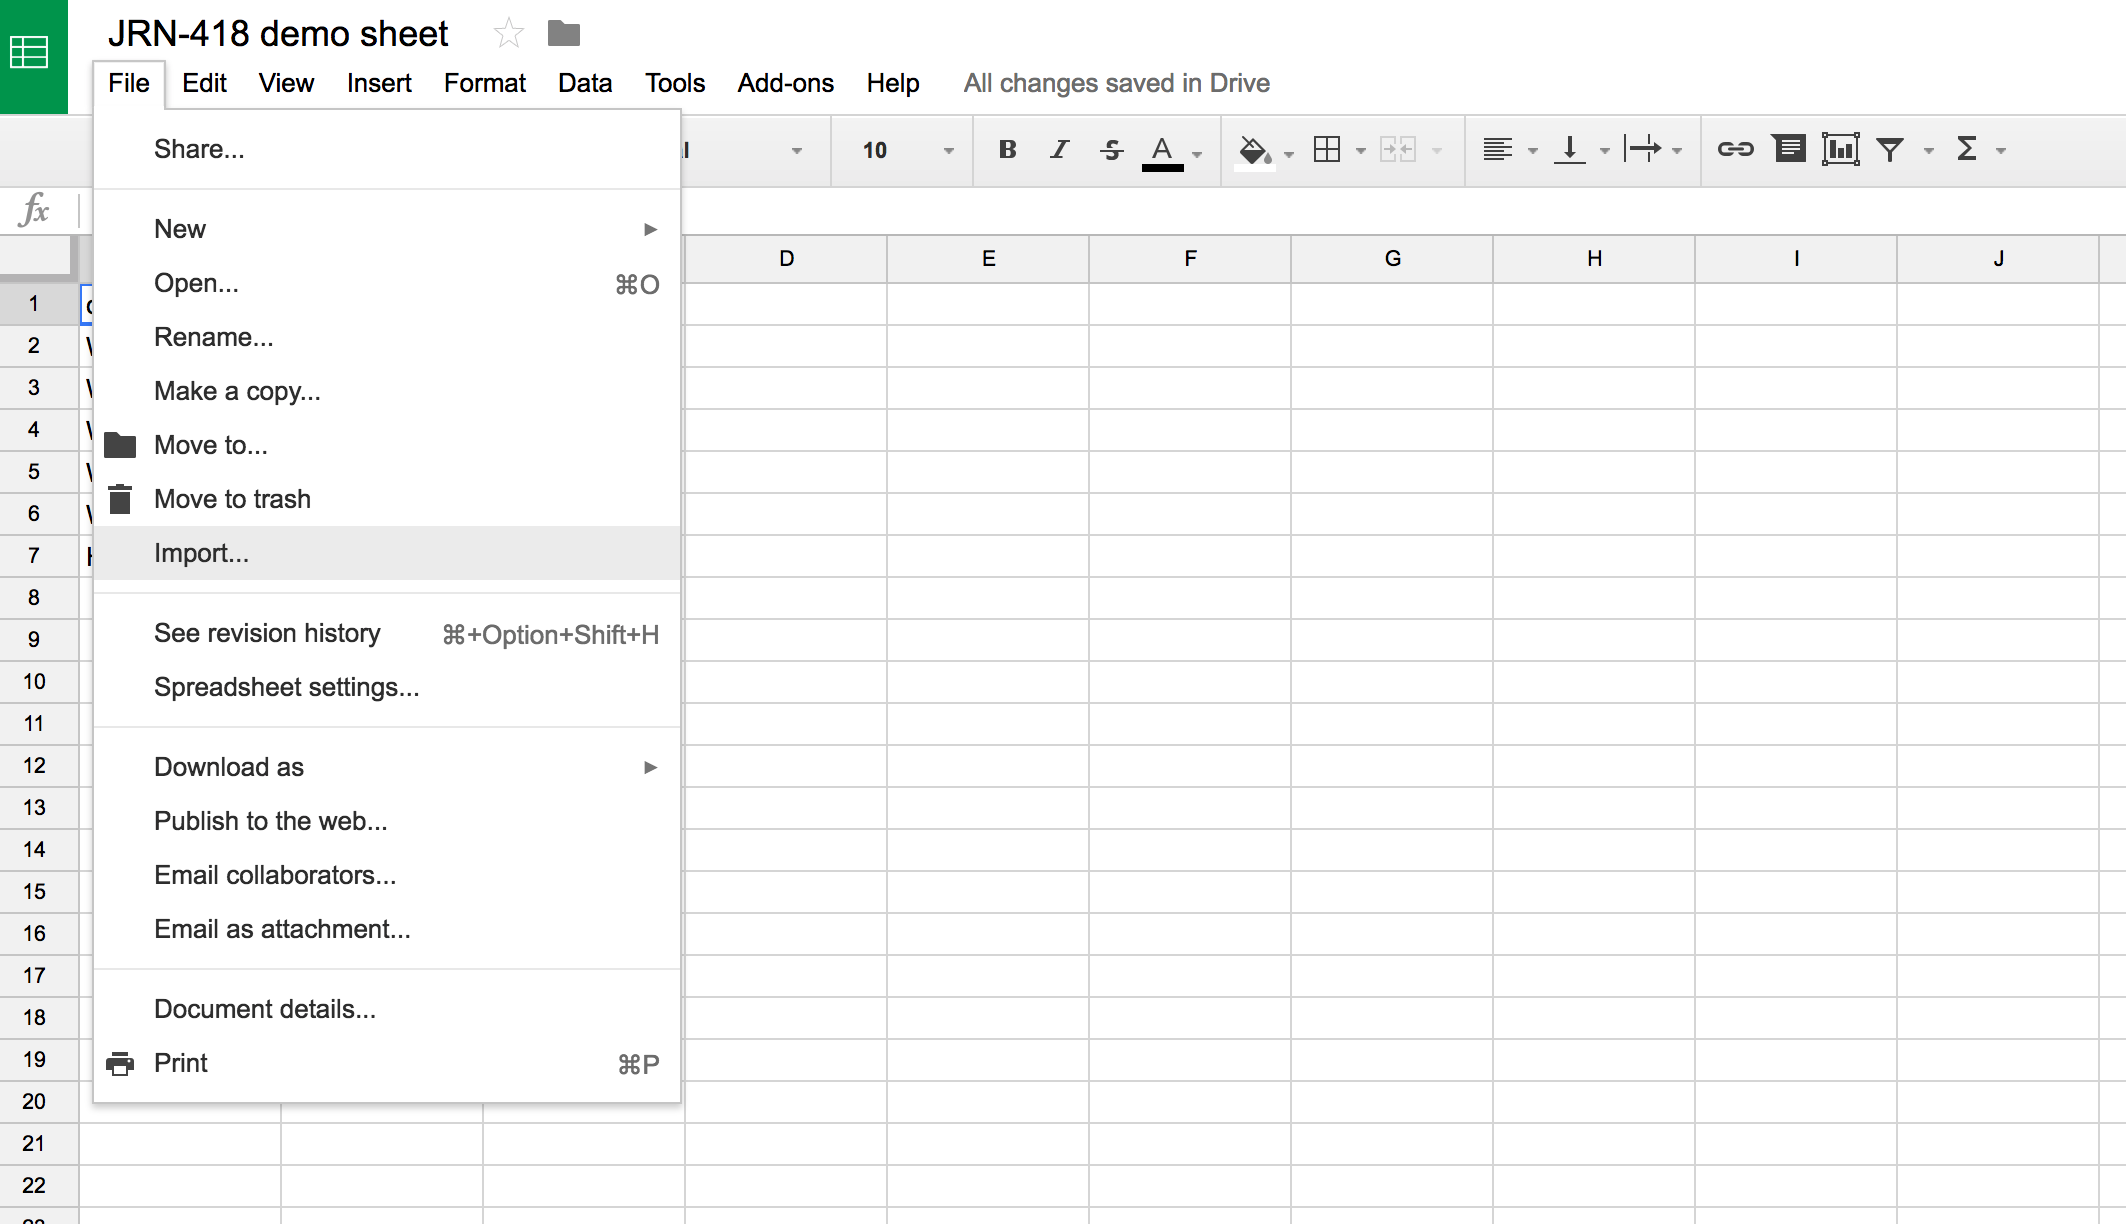
Select File > Import
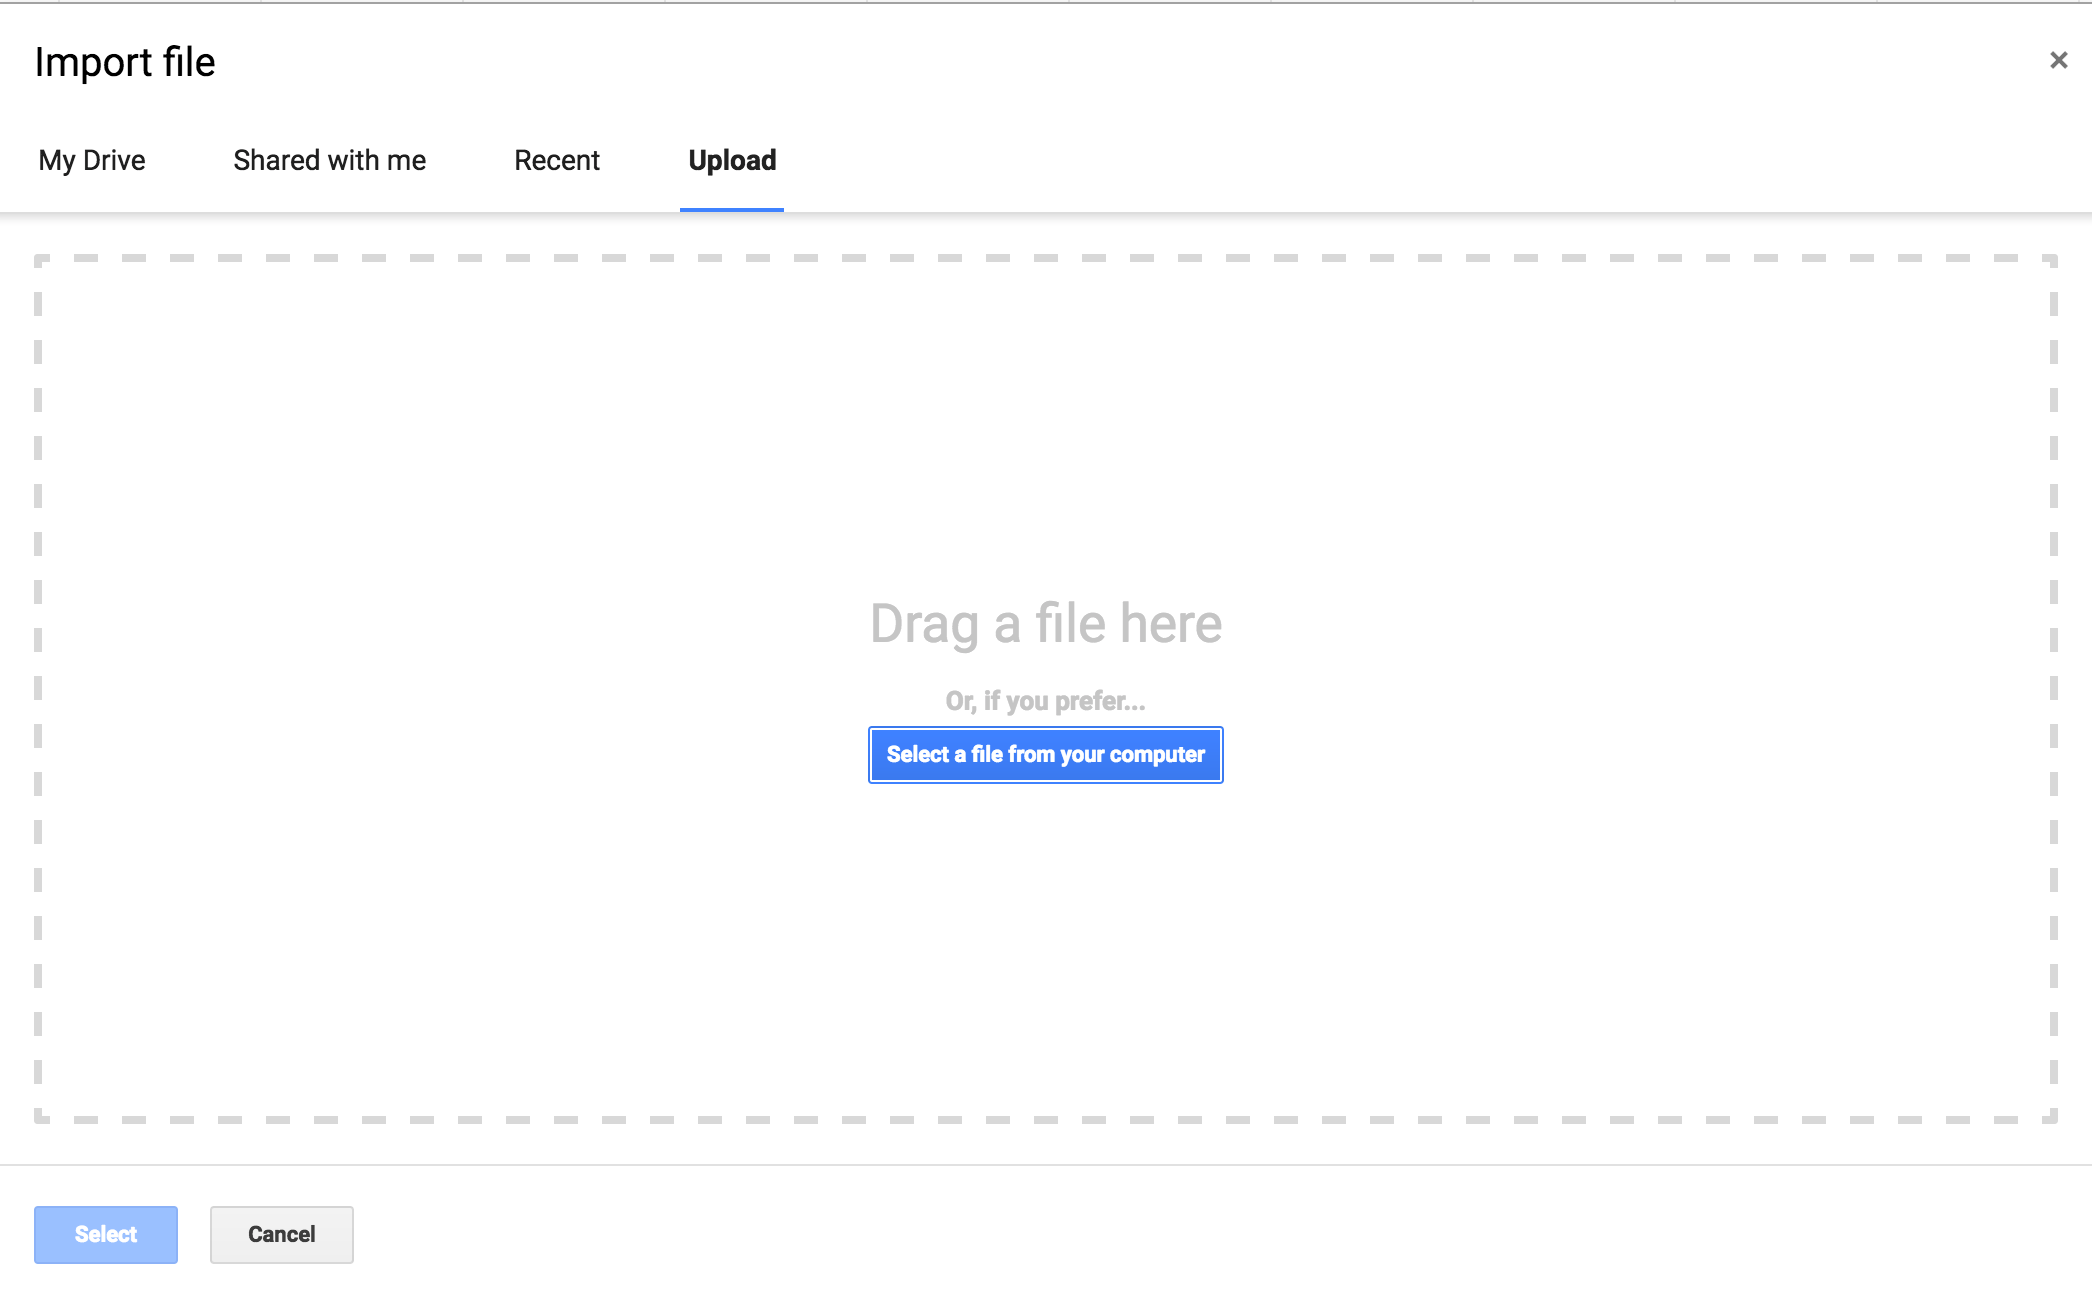
Click the Upload tab on the right and find the CSV file you downloaded and drag it in (or select it from your files).
Wait, what’s a CSV file? It stands for Comma Separated Values because if you look at the raw file, the data is separated by commas. In contrast, XLS stands for eXceL Sheets. If you look at the raw file, it’s just a bunch of code that only Microsoft’s Excel program can decipher.
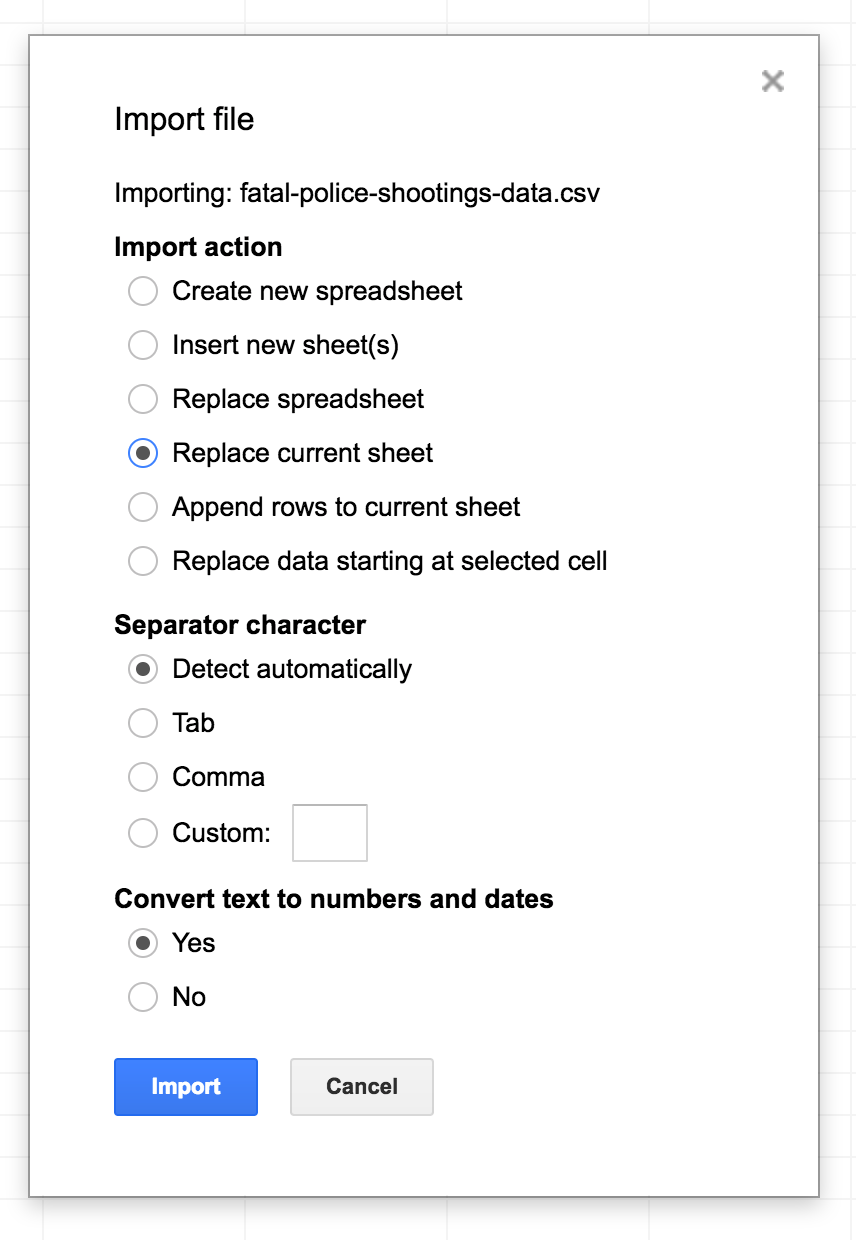
You’ll be presented with some options on importing the sheet.
Do you want to create a new spreadsheet entirely or just replace the sheet you’re looking at with the data you’ve got?
For now, let’s use Replace current sheet. Select that and click import.
Sorting
We’re looking at police shootings.
First things to do when exploring data is to see the range. Max and min and that sort of thing.
Question 1 we can quickly answer: What’s the youngest age someone has been shot by police?
We can do that by sorting the Age column.
Hover on the right side of the column header and a small triangle will appear. Click on it and a bunch of options will show up.
Select sort A - Z (this means descending order, like the alphabet). Vice versa, Z - A means ascending order.
There’s a problem now, though.
The column name age got sorted along with the data so now there’s no way to organzie the data.
We need to freeze the first row because those are the header names.
Press Command+Z to undo (CTRL+Z for PC users) the sort and bring it back to old order.
Select View > Freeze > 1 row.
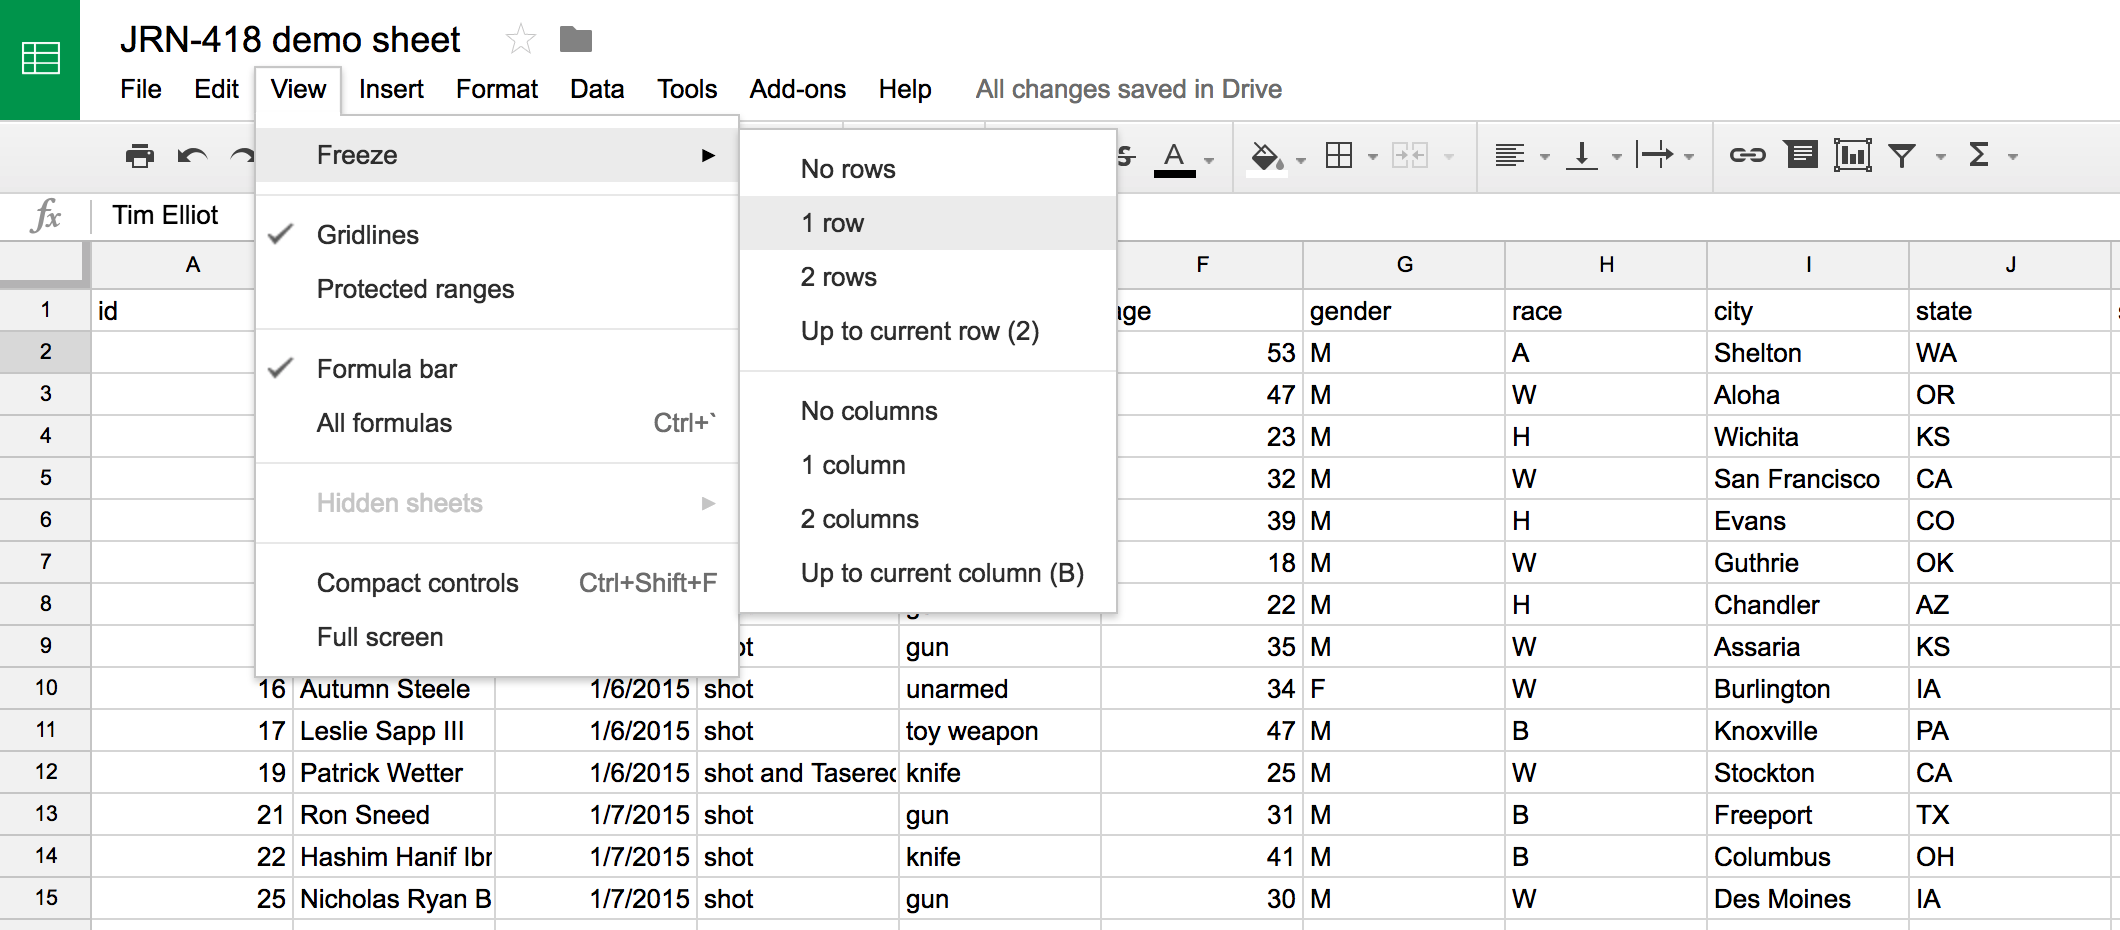
Now, you can sort without worrying about messing up the rest of the data.
Filtering
We have thousands of rows which can be overwhelming.
Let’s narrow it down by focusing just on the shootings that happened in Connecticut.
We have to enable filtering first.
For a single column, select the column header of the column you want to filter state and then click on the funnel button.
The little triangle will pop up permanently now in the header.
Alternatively, you can enable filtering on all the columns by making sure nothing is selected before clicking the funnel button.
Now, select the little blue triangle in the state column and then click Clear to get rid of all the states and scroll down and click CT so there’s a check next to it.
Click OK.
Alright, we have turned thousands of rows to just six. In two years, only six people were shot by police officers. It looks like all of them were holding ssome form of weapon (or something that could be mistaken for one).
A couple of them exhibted signs of mental health issues and half were perceived as attacking officers. Five of them were white. None of the officers involved were wearing body cameras.
Next steps
Congratulations, now you’re ready to dig a little deeper using pivot tables, which summarises the data. This enables you to answer questions like: Which states have the most shootings? What’s the average age of victims?
If you’re ready to move on, check out this walkthrough which shows how using a different dataset (keep using this one, though).