Working with data in Google Sheets
Pivot tables recap
Start with the Washington Post shootings data once more
We’ve summarized the total number of incidents per state already, right?
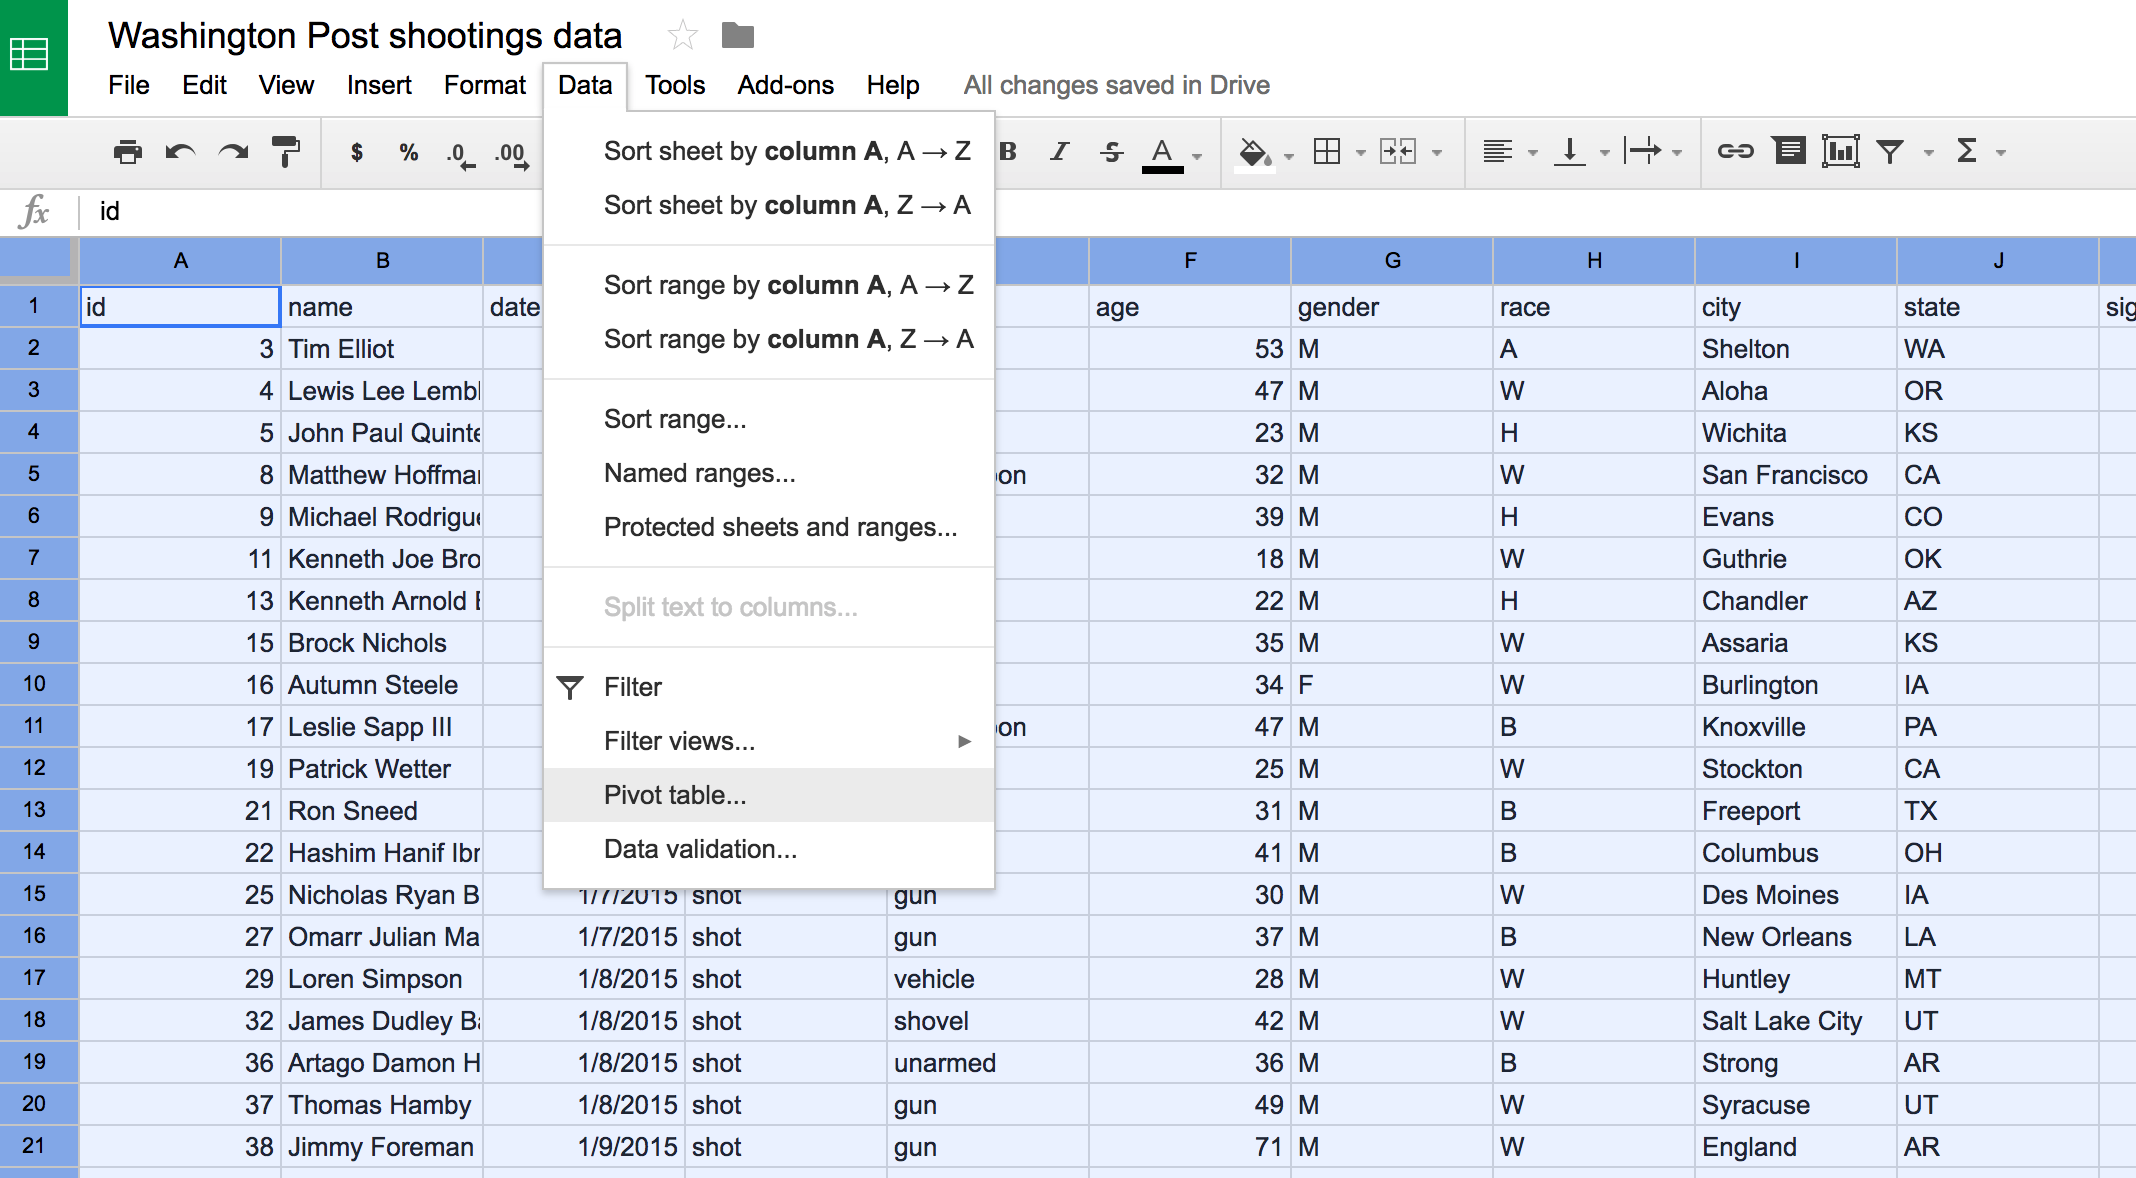
This was by selecting Group by: state under the Rows section on the right and by selecting Summarize by: COUNTA under Values.

Well, let’s go a bit deeper.
Pivot tables with rows and columns
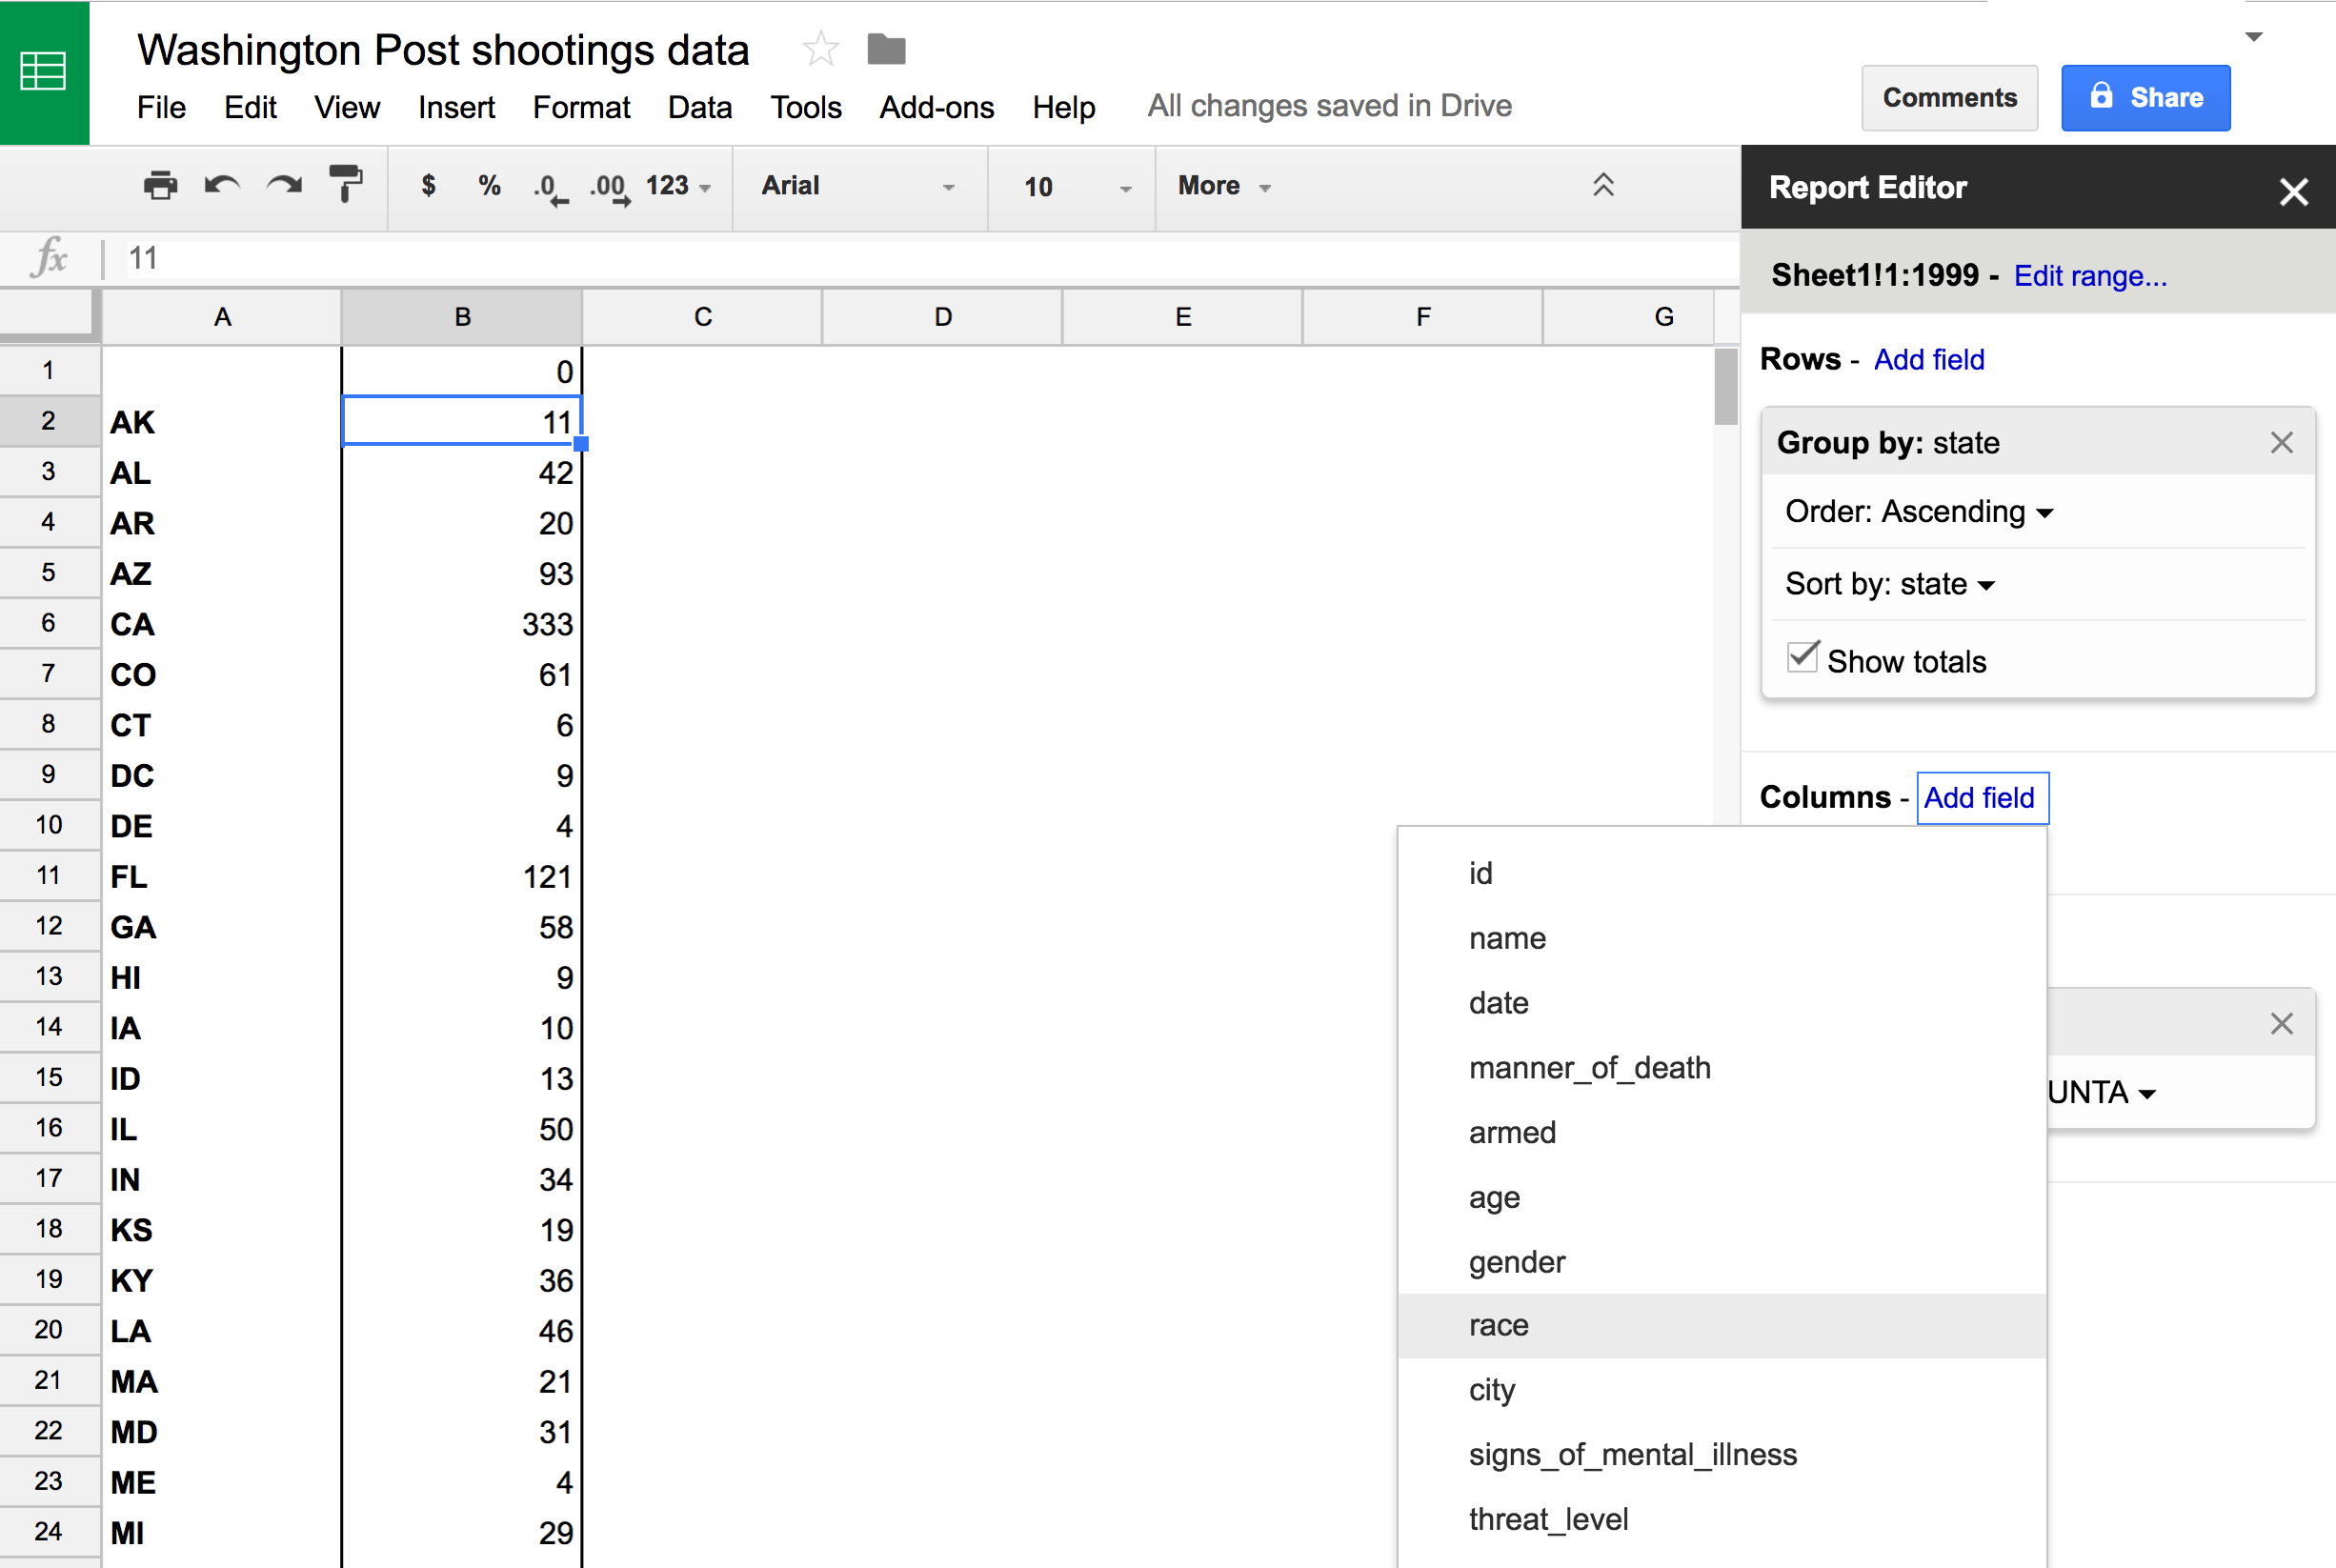
There are other categories in the Report Editor on the right that we haven’t used yet: Columns and Filter.
At the moment, with just Rows and Values filled out, we’re looking at just two dimensions of data.
But we can add another dimension by filling out the second category, Columns.
Let’s do that. Let’s click Add Field in Columns and pull down to select race.
Now we’ve added the extra factor of race into this summary.
We have both total overall incidents by state and total by race by state (Letters stand for race, A is Asian, B is Black, etc).
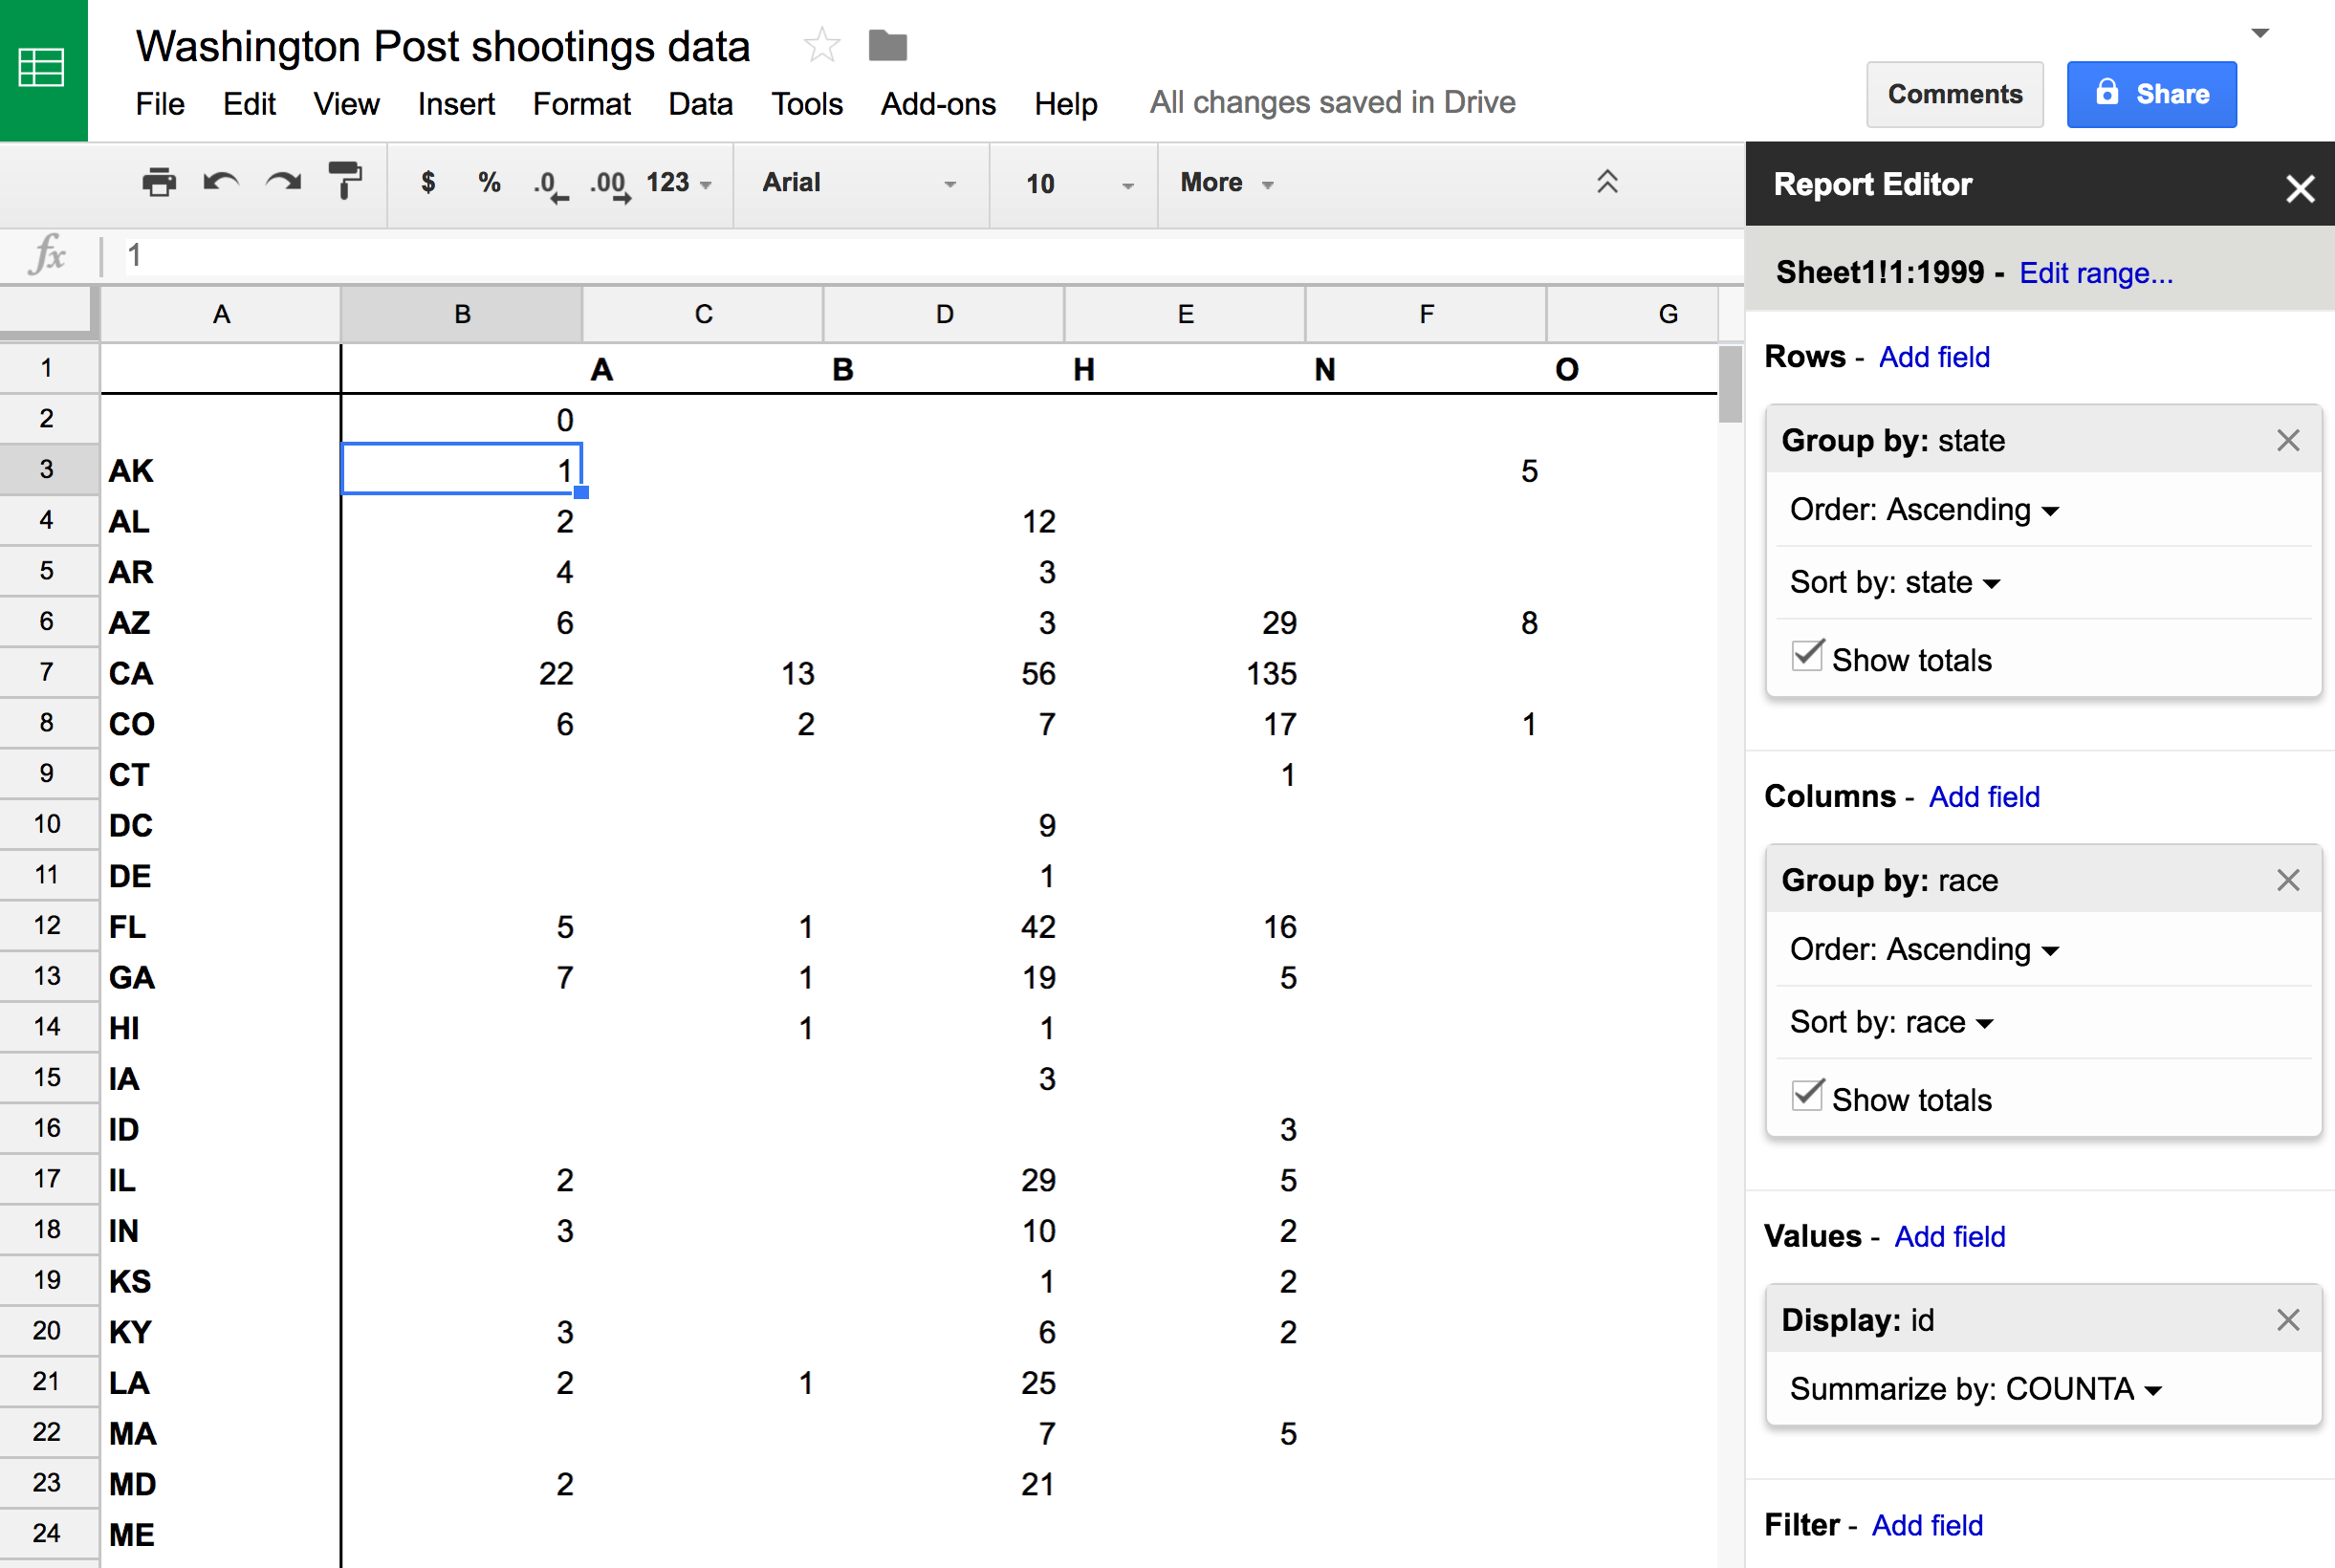
It’s a three dimensional data set now.
Note: Pivot tables are very powerful in summarizing and finding answers from data sets. Play around with the combination of factors you put in
RowsandColumnsandValues. You can put in more than one on each to get different subsetted values.
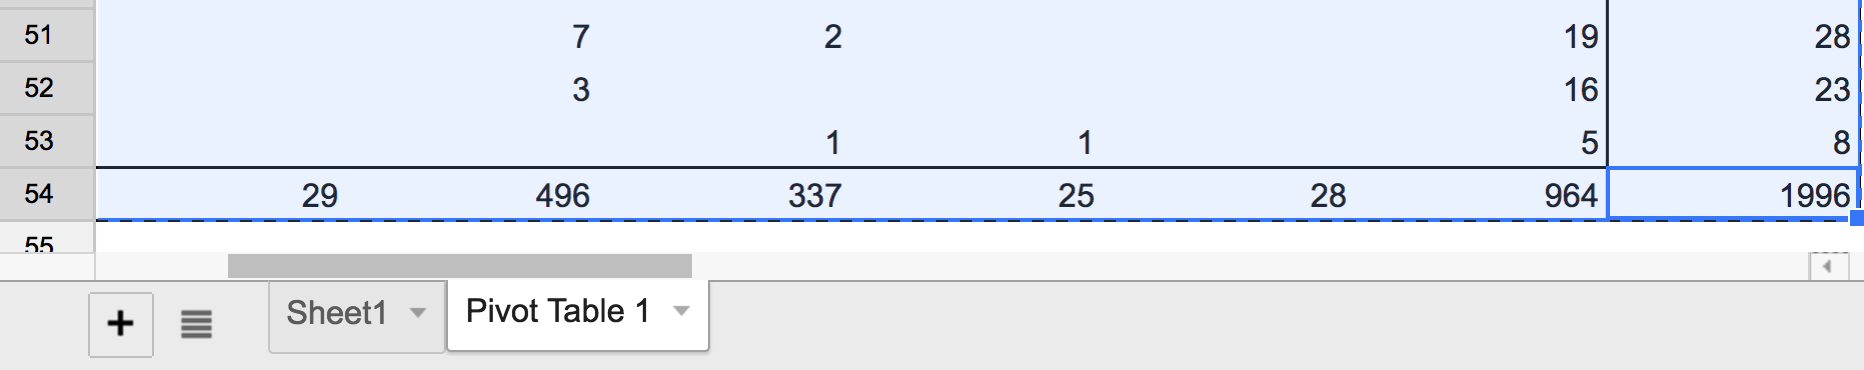
Sorting the data this way can answer the question:
In which state do Hispanics get shot most often compared to others?
We need to do some math on these results to break it down by percent.
We can’t do math in this current pivot sheet.
The data needs to be copied into another sheet so the data can be wrangled.
Select the cells and copy it (command + c or ctrl+c) and hit the + button on the bottom left to create a new sheet within the data you already have.
Click the name Sheet 3 and rename it Percent by race since that’s what we’re going to be doing with the data.
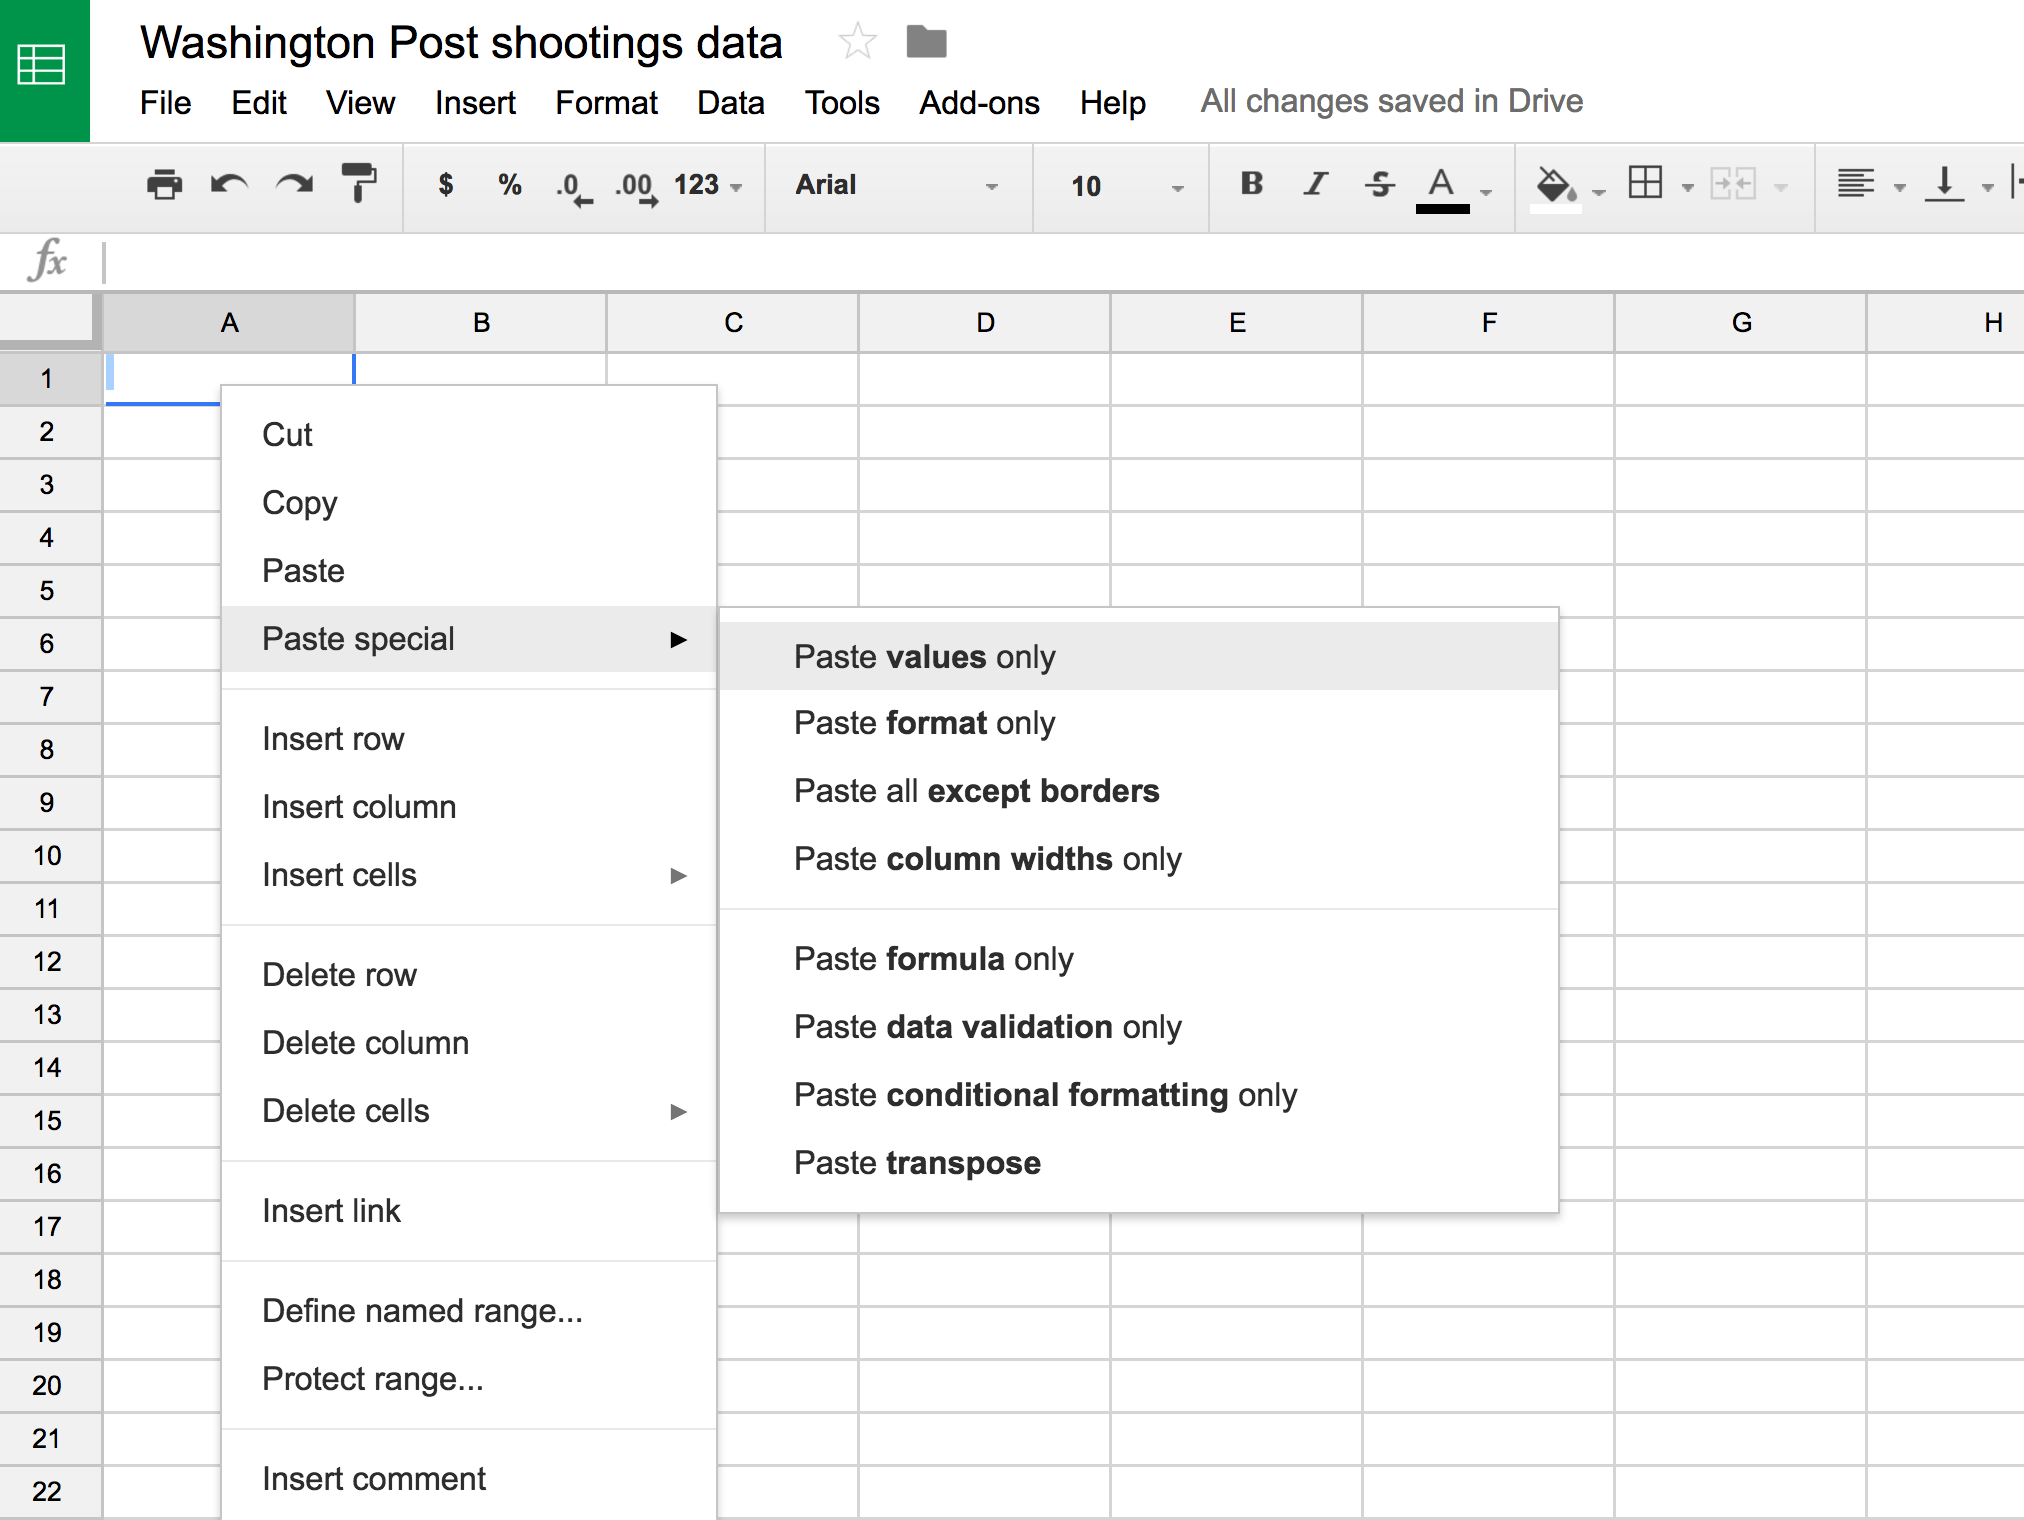
Important note about pasting: You can’t just copy and paste data without sometimes picking odd formating and code behind that data. When transforming data, it’s good practice to strip that out by being sure to right+click and select
Paste values only.
Ok, Paste values only the pivot table data into the Percent by race sheet.
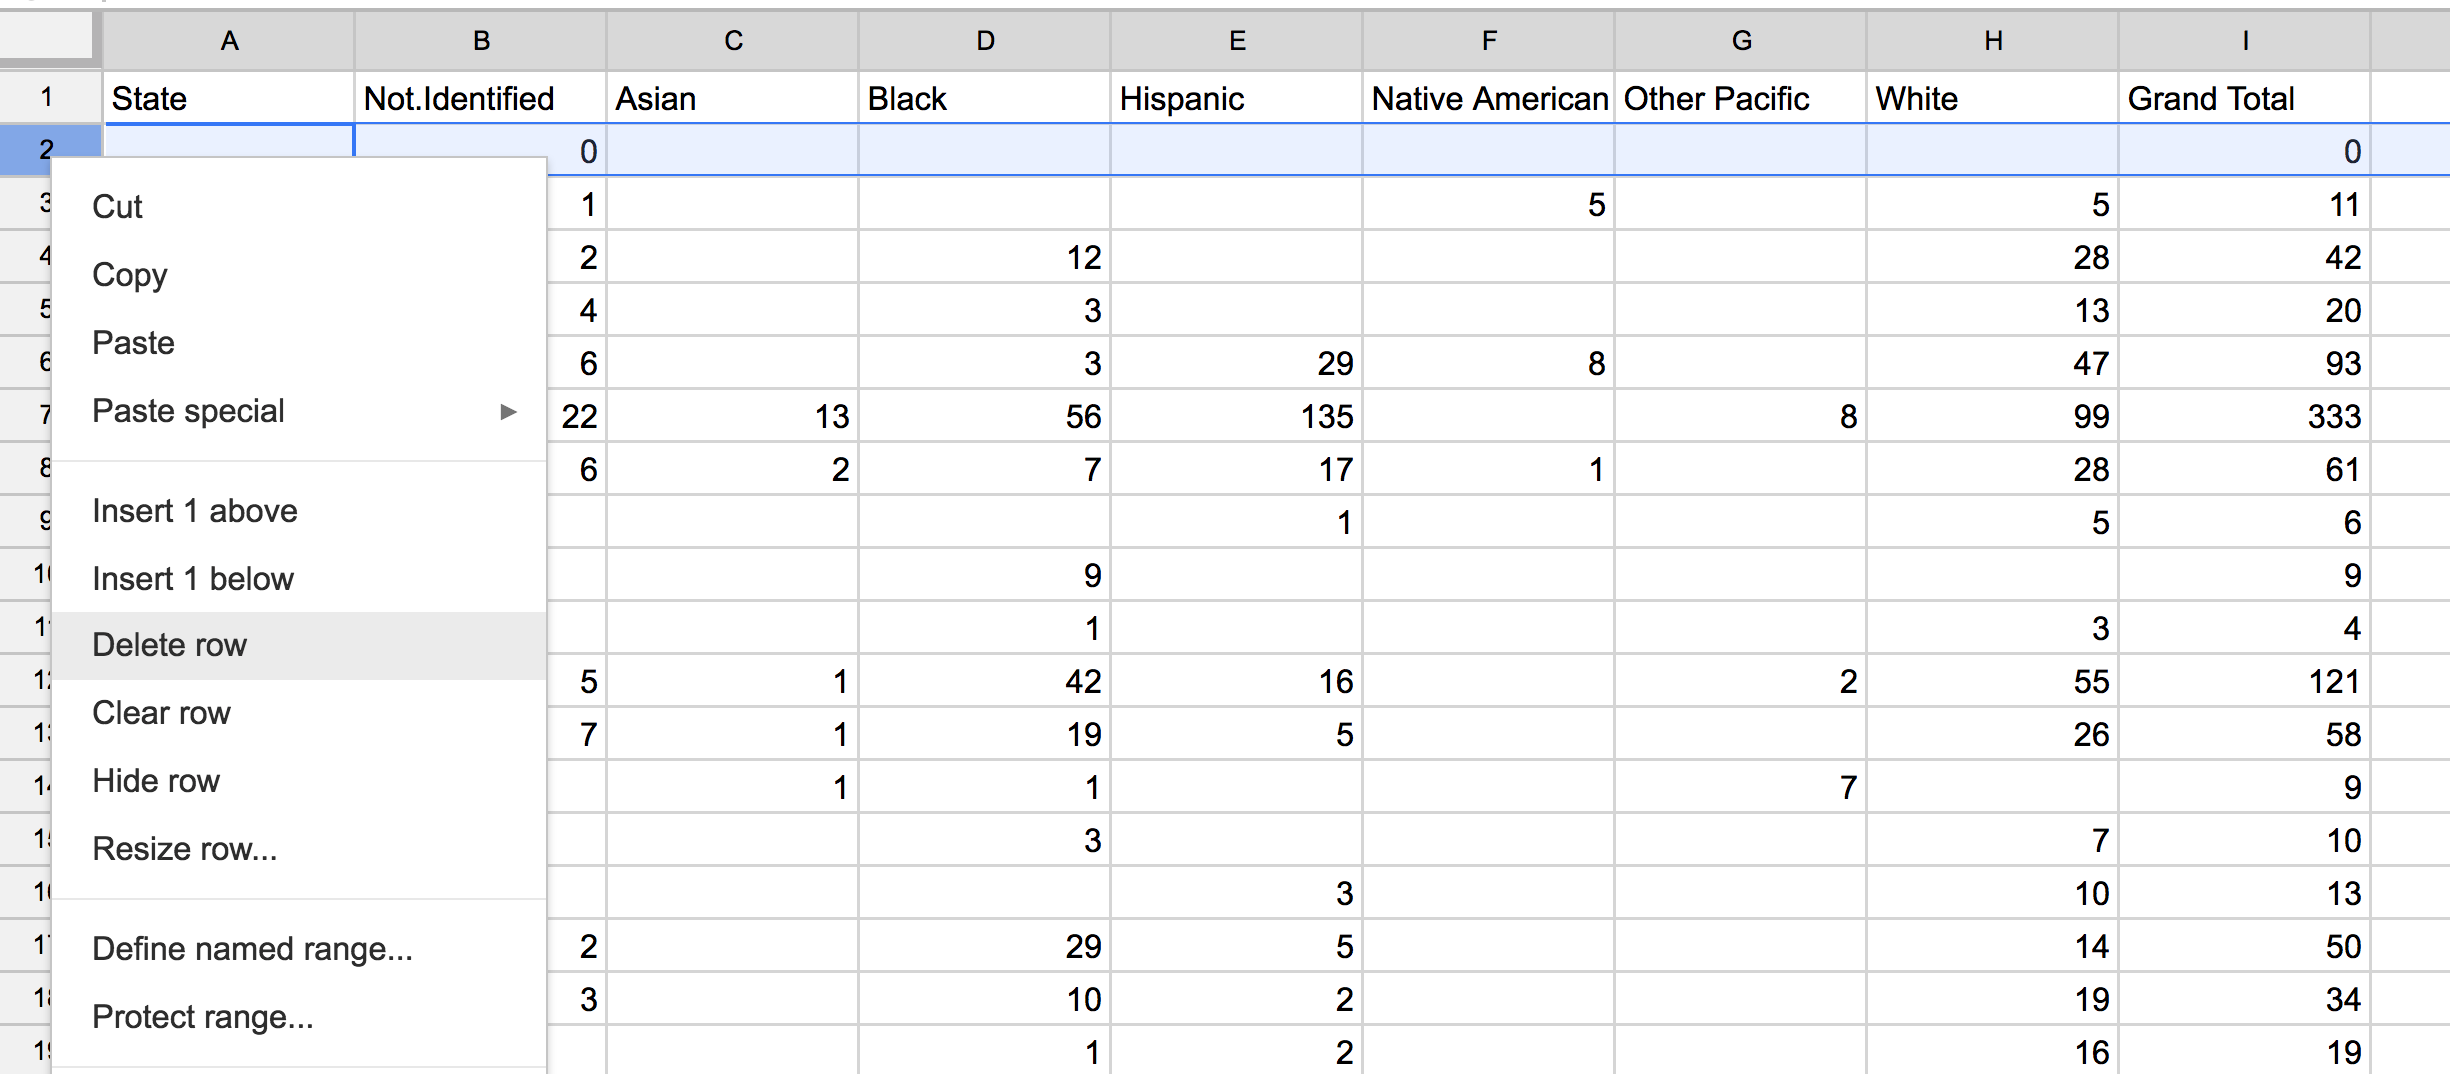
It should look like this.
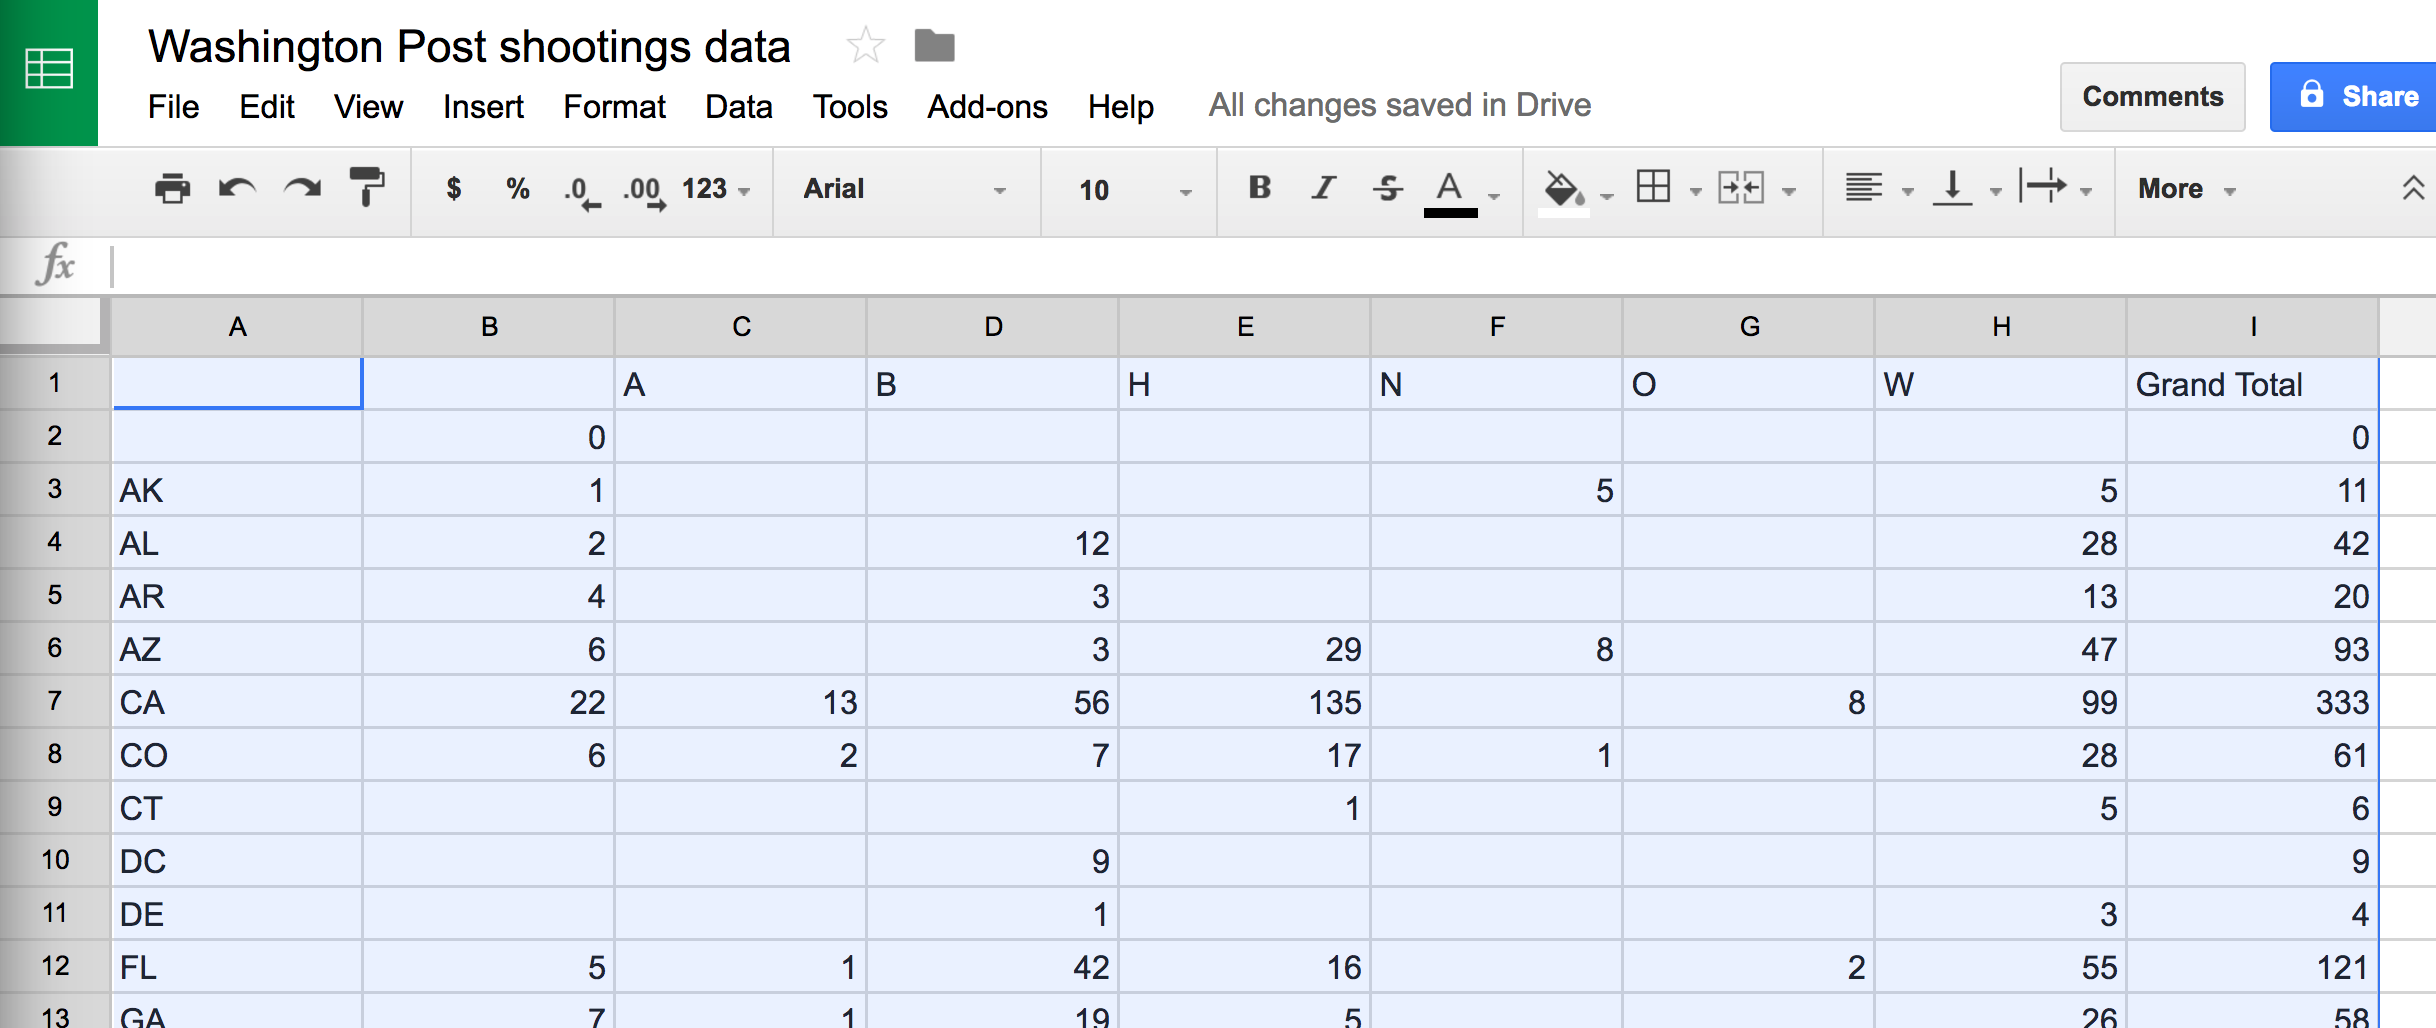
Notice how the format is slightly different?
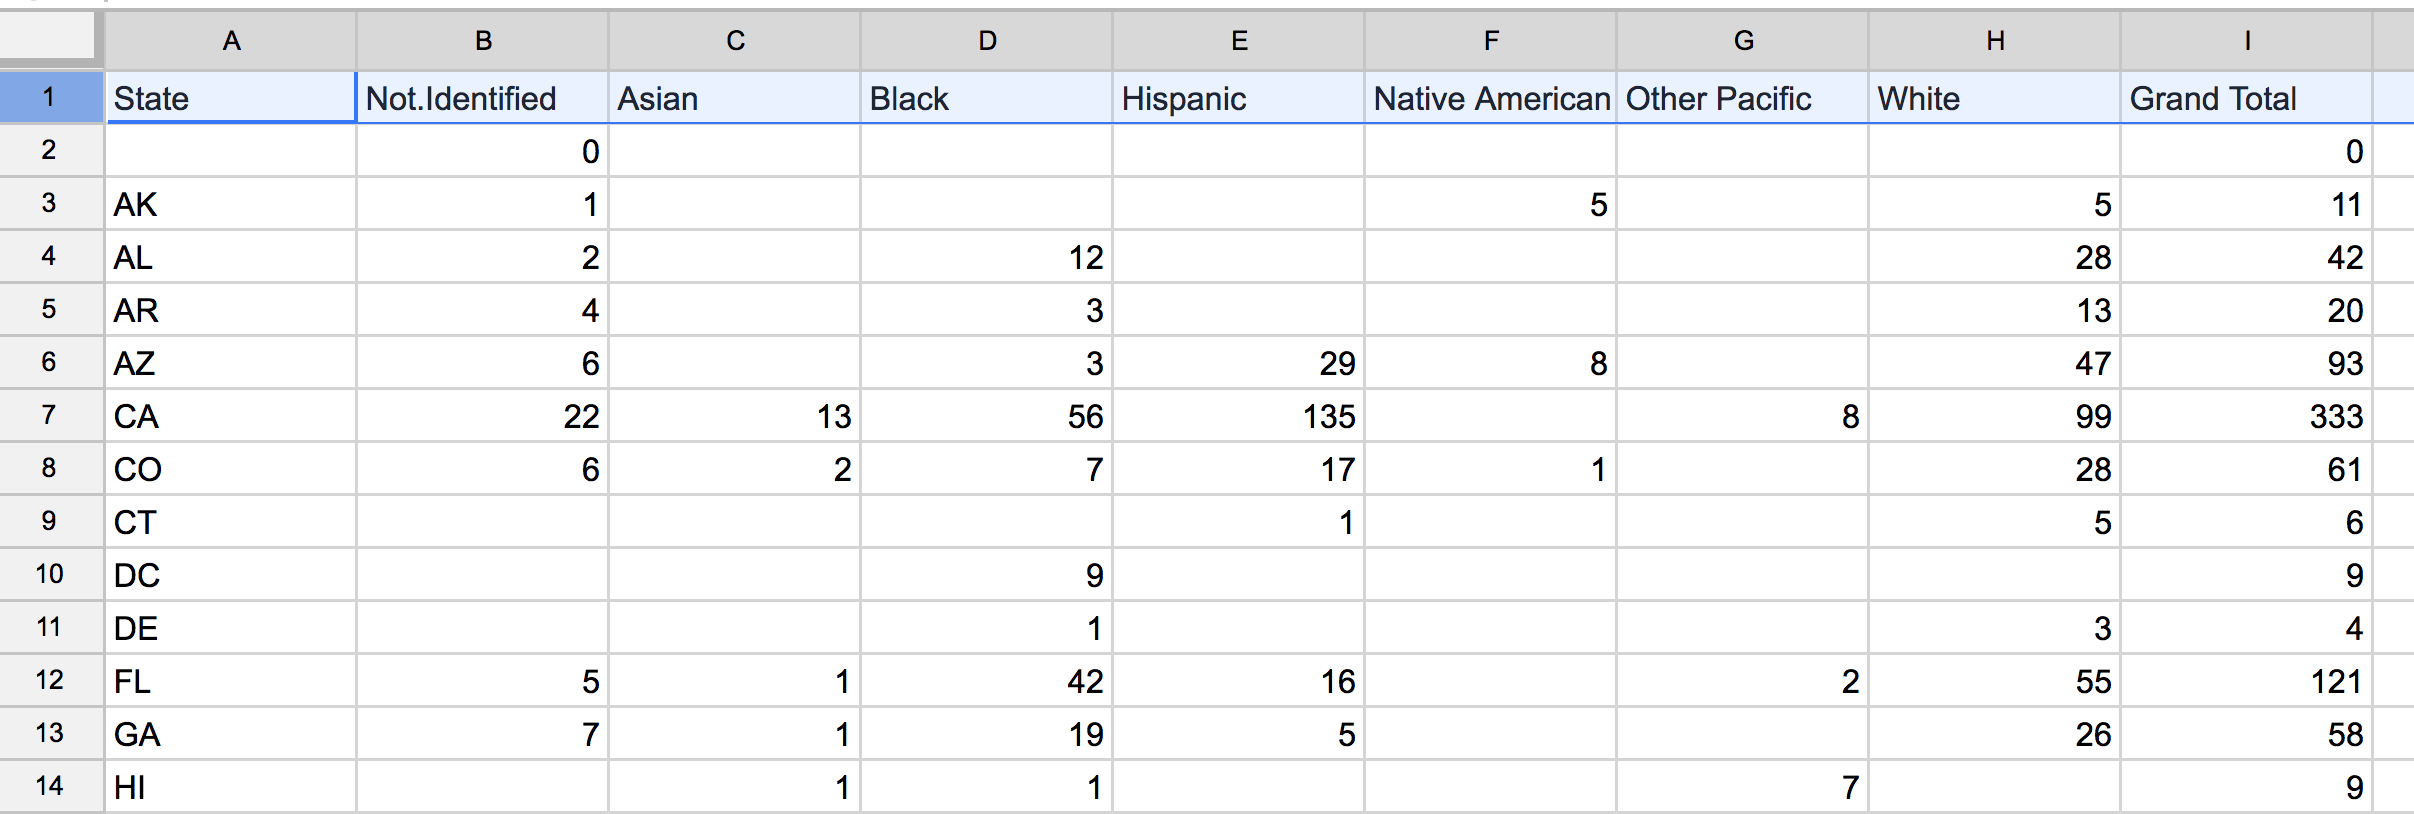
Alright, let’s clean up the column names now.
Label the first blank column State and the second blank column Not.identified.
Replace the single letters for races (A is Asian, B is Black, H is Hispanic, N is for Native American, O is for Other Pacific, and W is for White)
Deleting a row
We need to clear the second row because there’s blank data there.
Select the row header 2 and right click and select delete row.
Alright, now we can do some math. We want to find out the percent of shooting incidents with police by race by state.
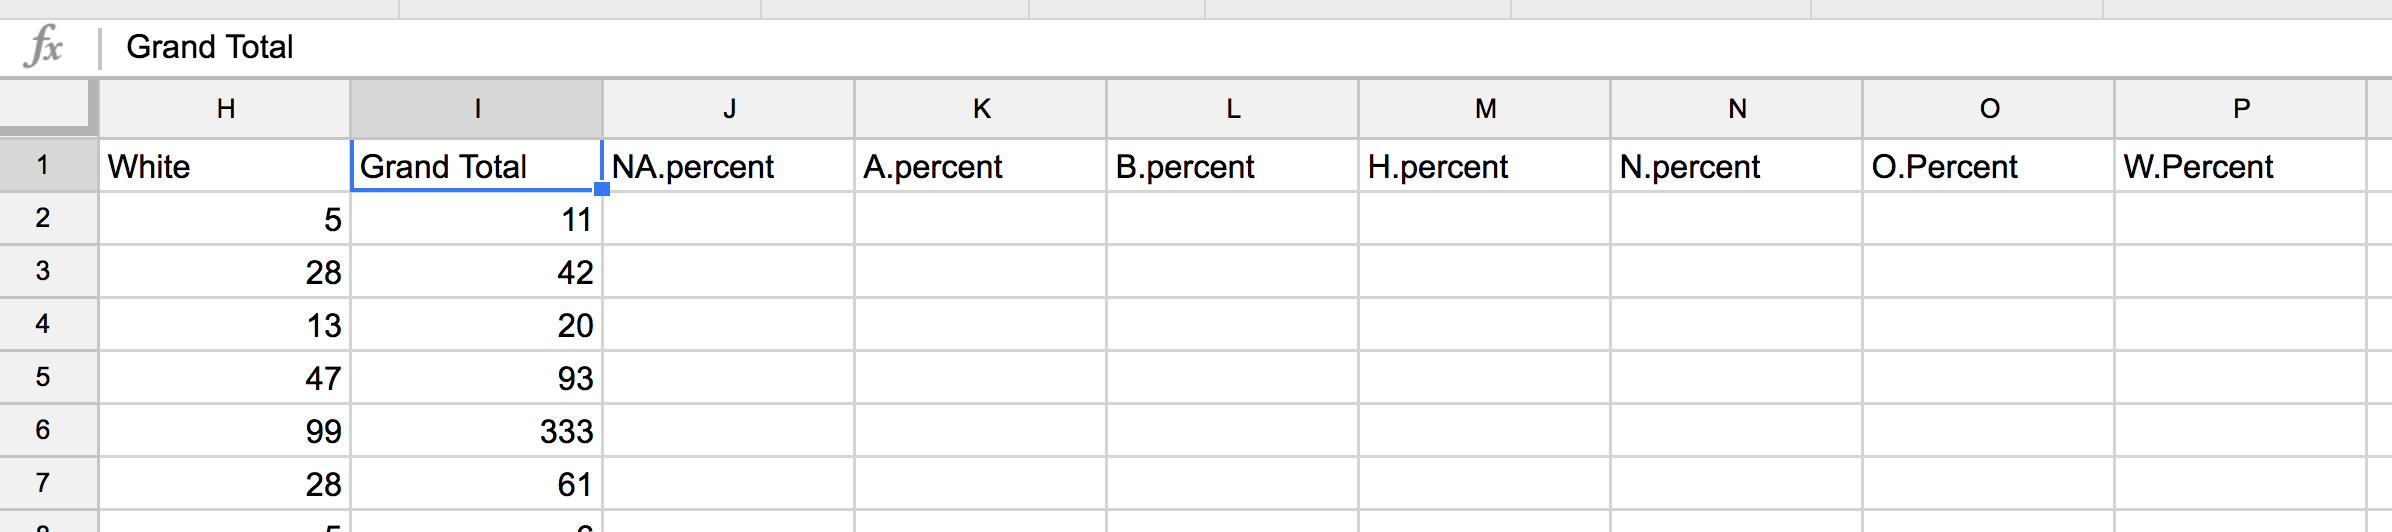
We need to create new column headers for where we want the data to go.
Scroll past Grand Total in Column I and add these columns:
- NA.percent
- A.percent
- B.percent
- H.percent
- N.percent
- O.percent
- W.percent
Formulas
A formula is used in spreadsheets to represent an expression, which, when entered into the cell tells the spreadsheet to perform a calculation based on the values in the other cells and displays the result.
Formulas contain references to other cells, mathematical expressions, or advanced programming functions.
What’s a percent? It’s the overall share out of the total. (Like grades– a student earned however many points out of a total pool of points gets them their grade point, which translates to a grade letter)
So let’s look at shootings among blacks in Alabama.
We have Grand Total of all shootings in the state and we have total shootings for just Black.
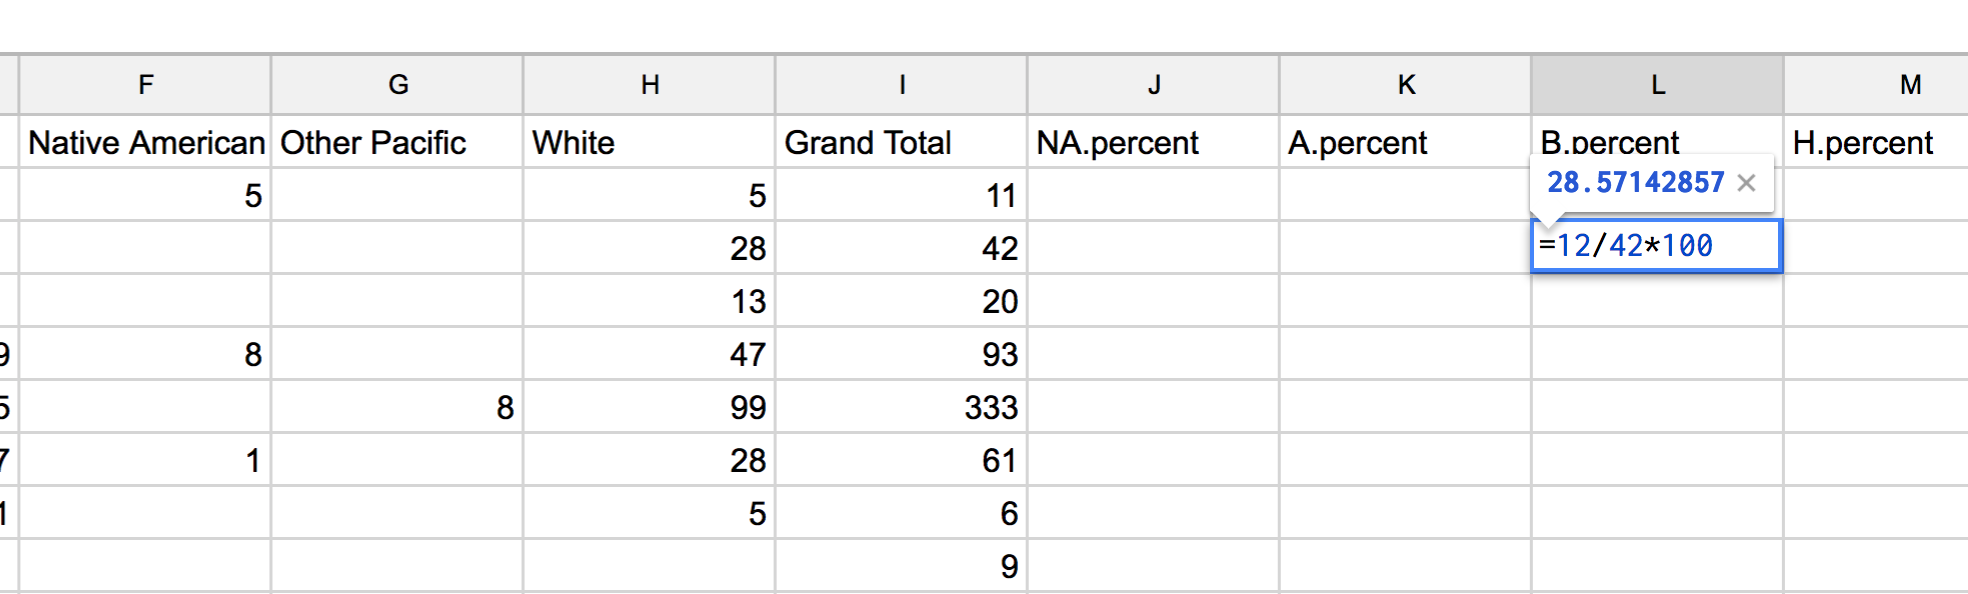
We need to divide the number in Grand Total for Alabama by the number in Black and multiply by 100 to get the percent of blacks shot by police.
Formulas in spreadsheets always begin with an = sign. If you try to put in a = by itself, you’ll get an error.
So = and then math.
If you type in the values of Total and black total as a formula, you get =12/42*100. Type that into the correct cell and click out of the cell gives you would give you 28.57142857. (But click back into the cell and you get the formula)
Alright, but typing in the values takes too long.
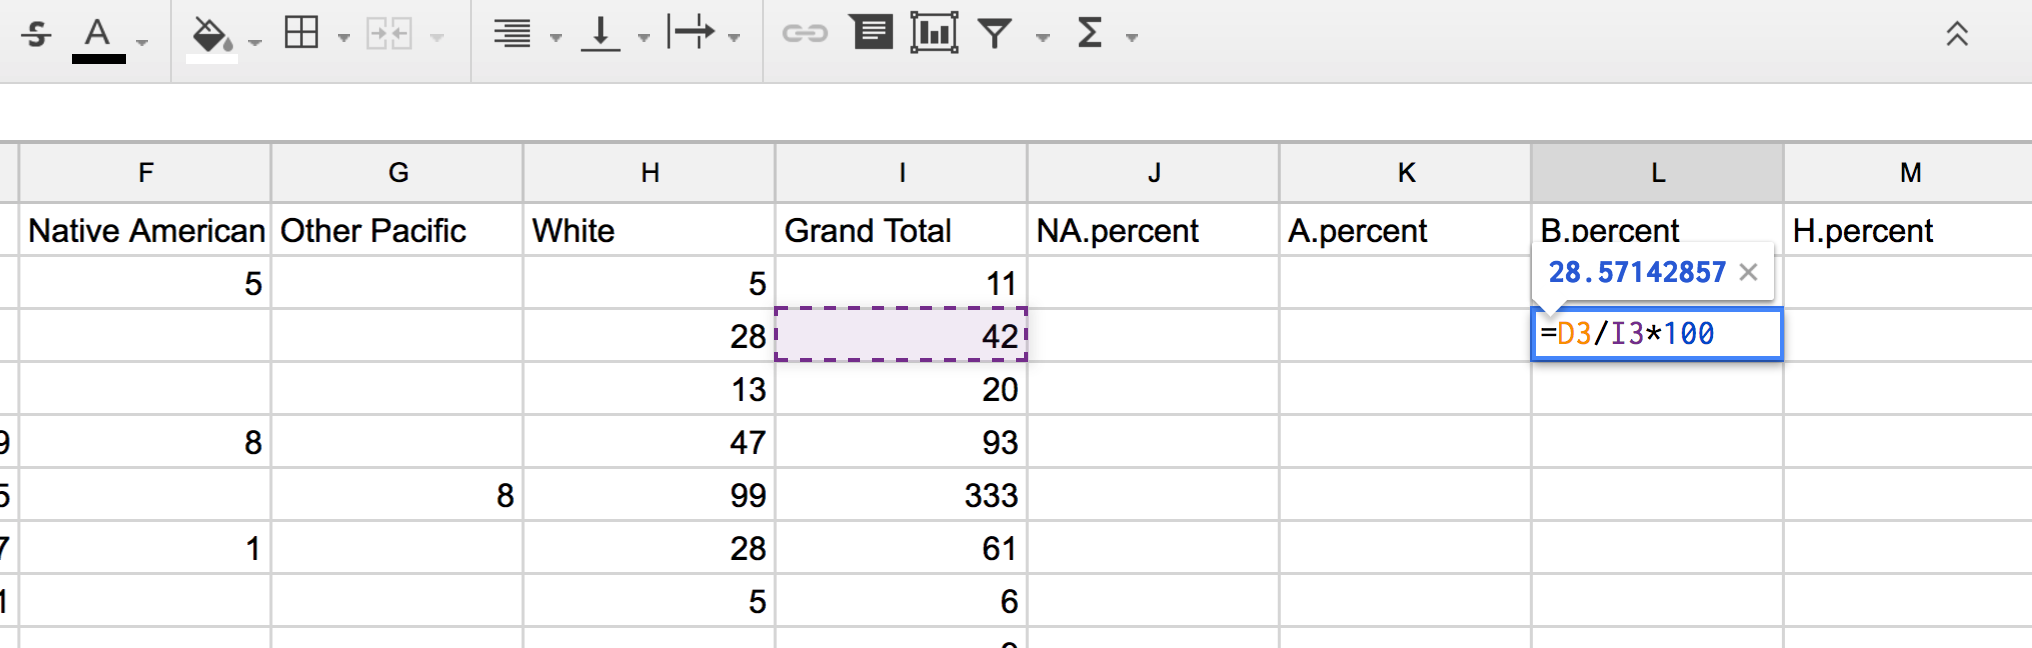
You can use cell location instead of the numbers. So Alabama (Row 3) + Black (Column D) is D3 and Grand Total for Alabama is Column I and Row 3 (so that’s I3)
Two options: Type it or just select it (after you put in the = so the app knows you’re selecting cells).
So =12/42*100 is also =D3/I3*100.
Applying the formula to other rows
Copy and paste the formula that you just created into the cell above it to see what the percent is for Alaska.
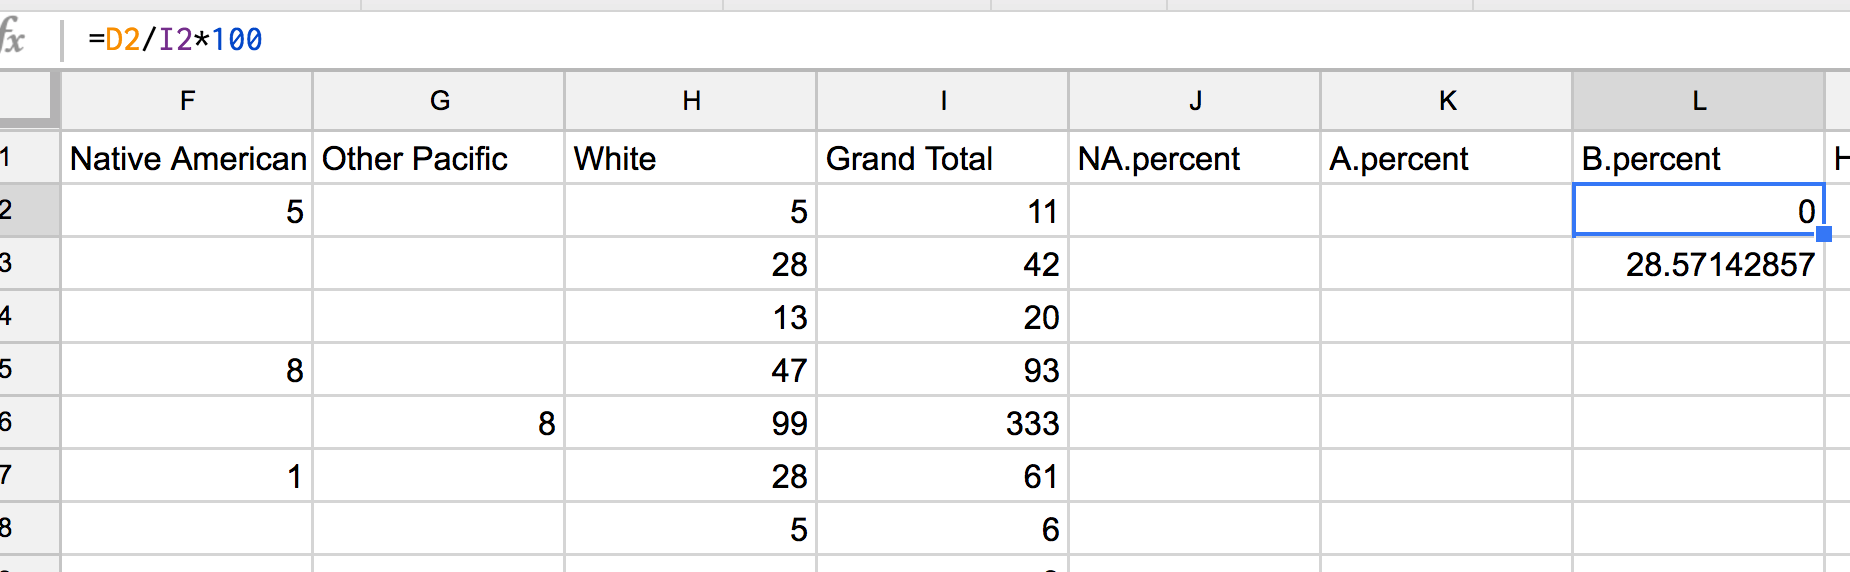
The formula is now =D2/I2*100 but you didn’t change anything, right?
That’s because spreadsheets have contextual awareness when it comes to formulas.
Spreadsheets assume you want to keep the structure of the formula but change the values.
Here’s another example.
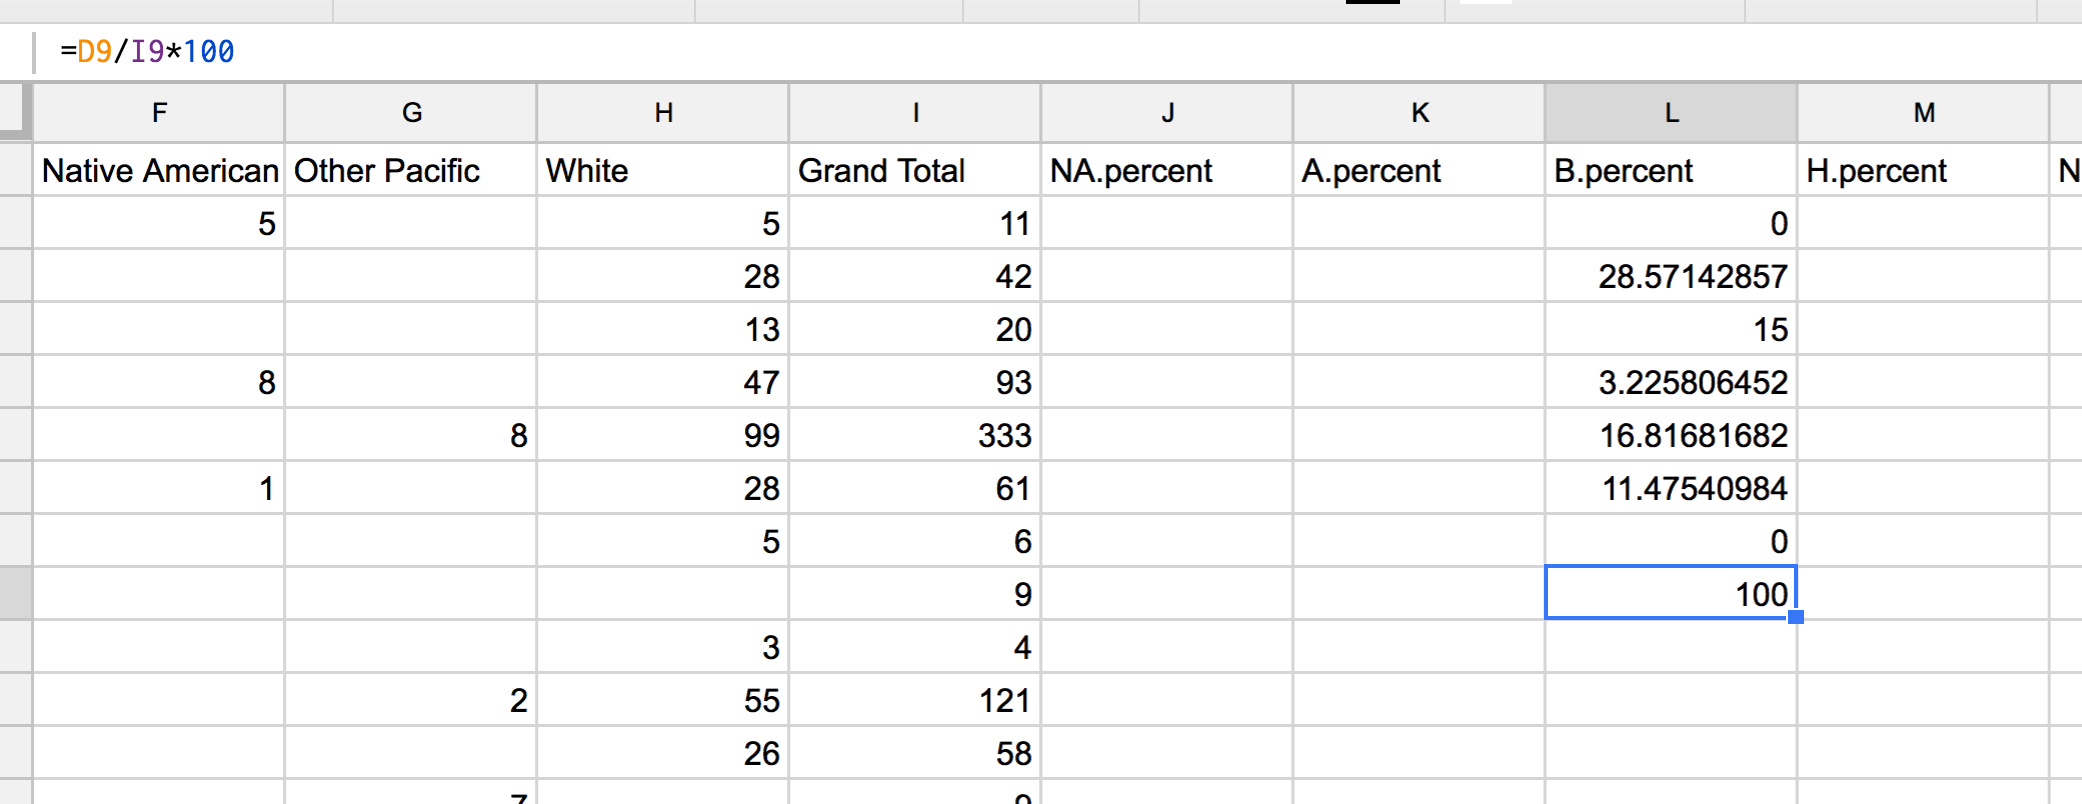
Select the cell with the formula in B.percent and find the little blue square on the right bottom corner.
Drag it down a few cells.
Same thing.
The spreadsheet will keep the columns (D and I) consistent but will change the row number based on its relation to the others.
Here’s another way to apply the formula to the rest of the cells:
Double click the little blue square on the bottom right corner of the cell this time.
Tip for applying: Sometimes dragging the little blue box can take a long time if you have a very long data set. Double click the little blue box if you want to apply it to the rest of the column. However, this only works if the columns you’re working with are not interrupted by a blank cell.
Formula for a static column
Alright, let’s find the percent breakdown for Hispanics, next to the black column.
We already have the formula for calculating Black percentage so it makes sense to try to apply that to the Hispanic column.
Try dragging the little blue square in B.percent for Alabama to the right over to H.percent.
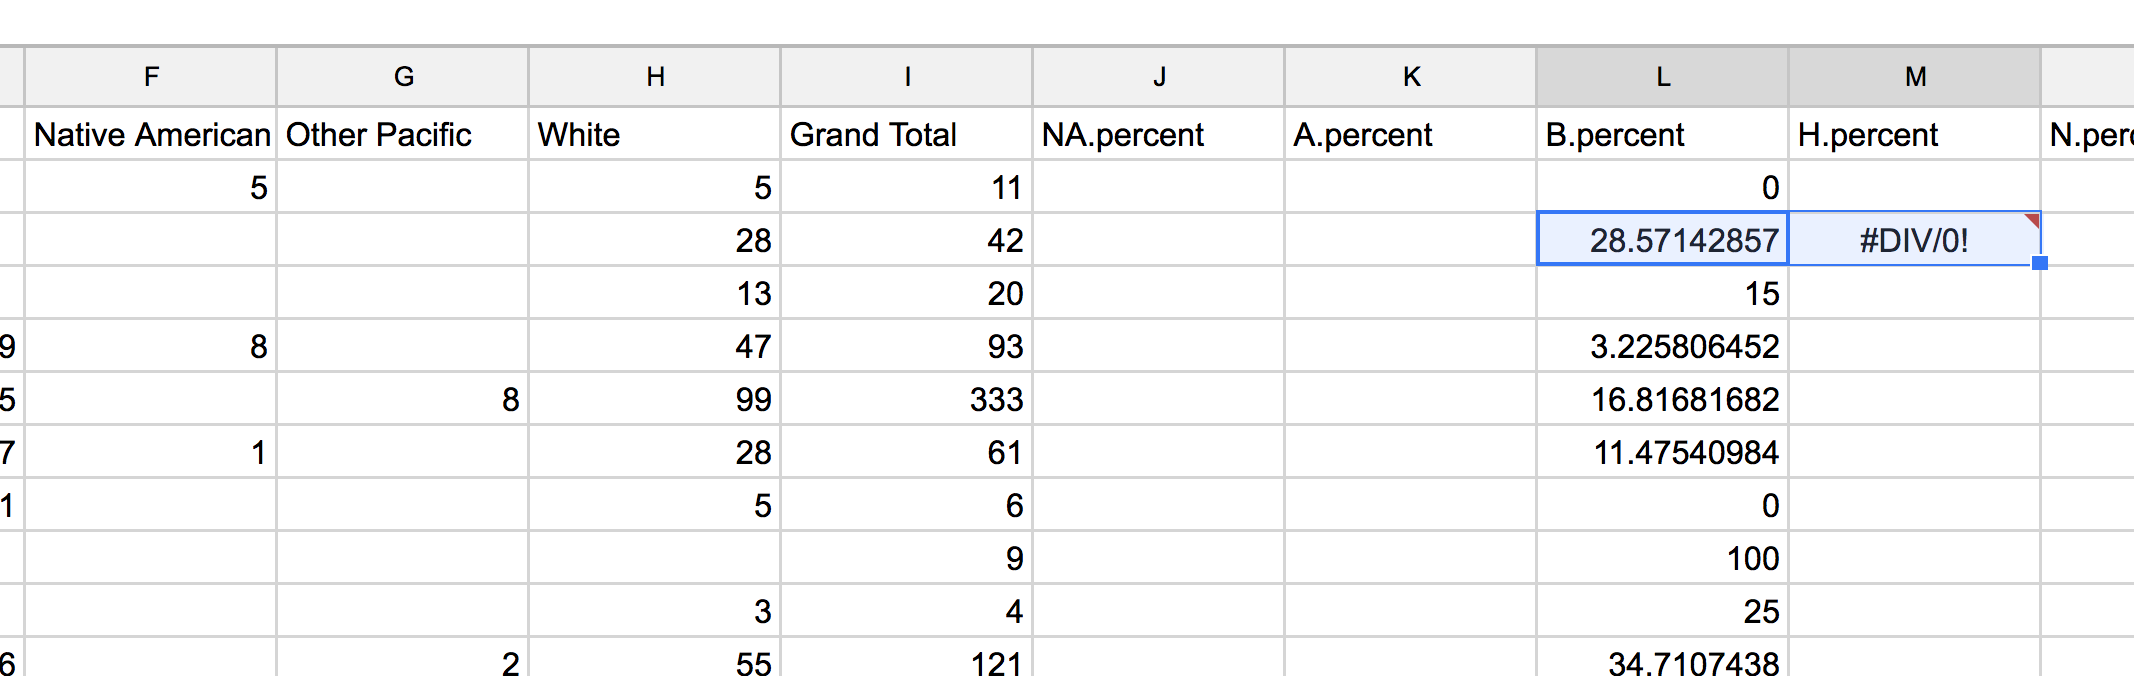
Looks like we have an error.
What’s the deal?
Click into the cell.
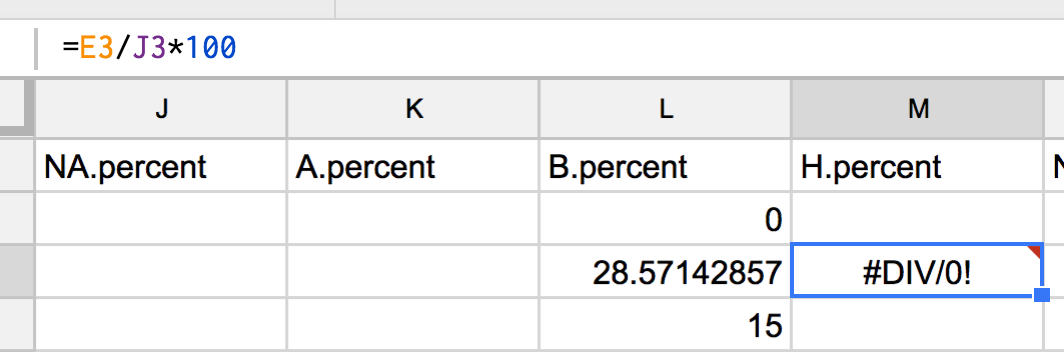
Look at the formula. It’s =E3/J3*100 which is the cell for Hispanic + Alabama (that’s correct) divided by the cell for NA.percent in Alabama (not correct).
Why did it do that?
Because it assumed you were trying to do math on it like with the rows earlier.
Every time the formula moves over a row, it assumes the values for each should move over, as well.
And that’s true for the race totals but not for Grand Total. All values will change except that.
This is how you tell the spreadsheet app to freeze where it’s looking, with a $ sign.
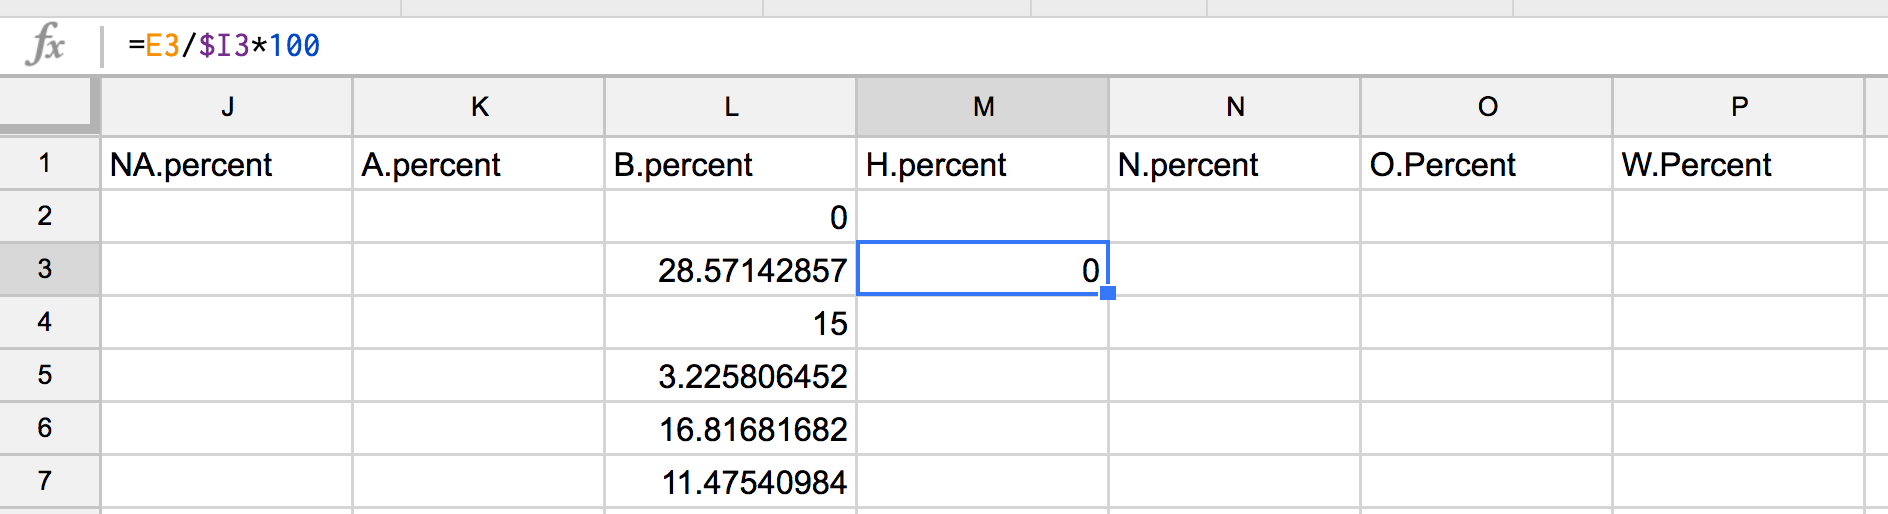
So the correct formula for determining Hispanic percent in Alabama is =E3/I3*100, right?
To keep a value static (or unchanged) in a formula, you have to put a $ in front.
So the formula should be =E3/$I3*100. You’re letting everything change except the I column.
Now, drag the little blue box all the way to W.percent.
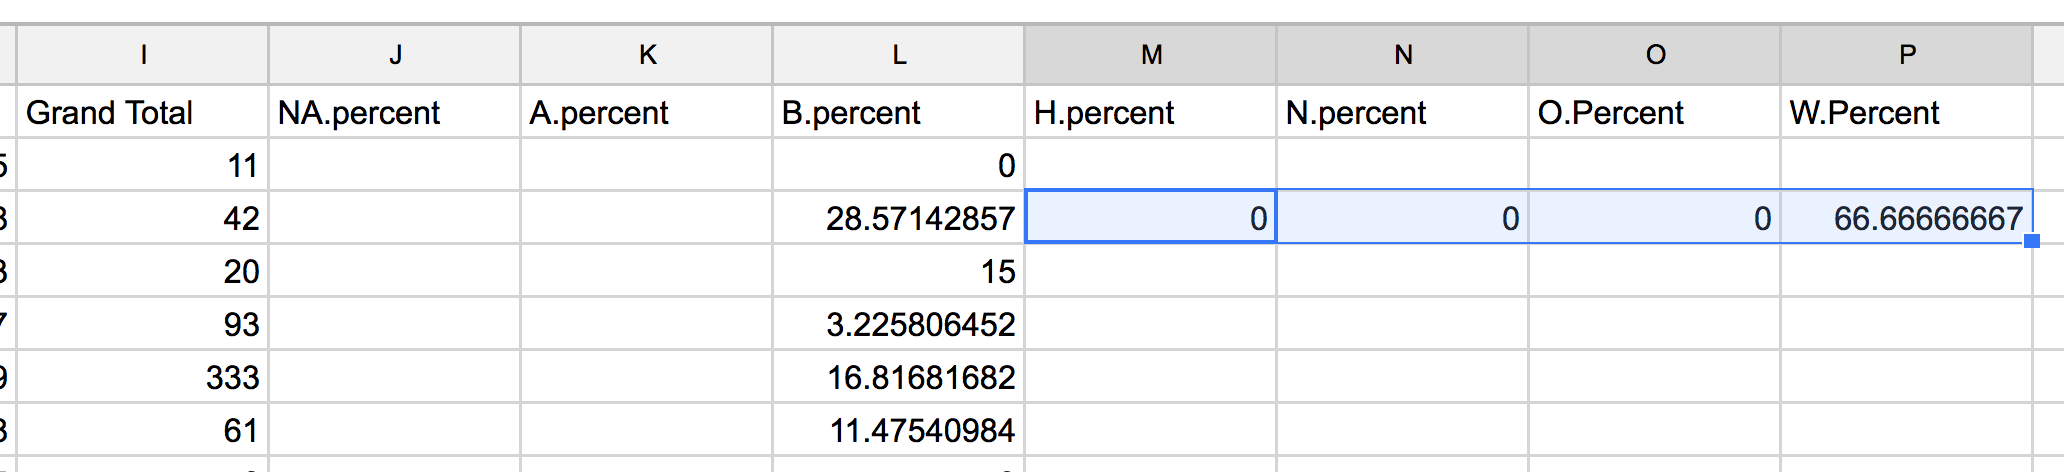
No errors, it worked!
Now! Double click that little blue square in the W.percent.
Cool, right?
It automatically filled in everything in that range.
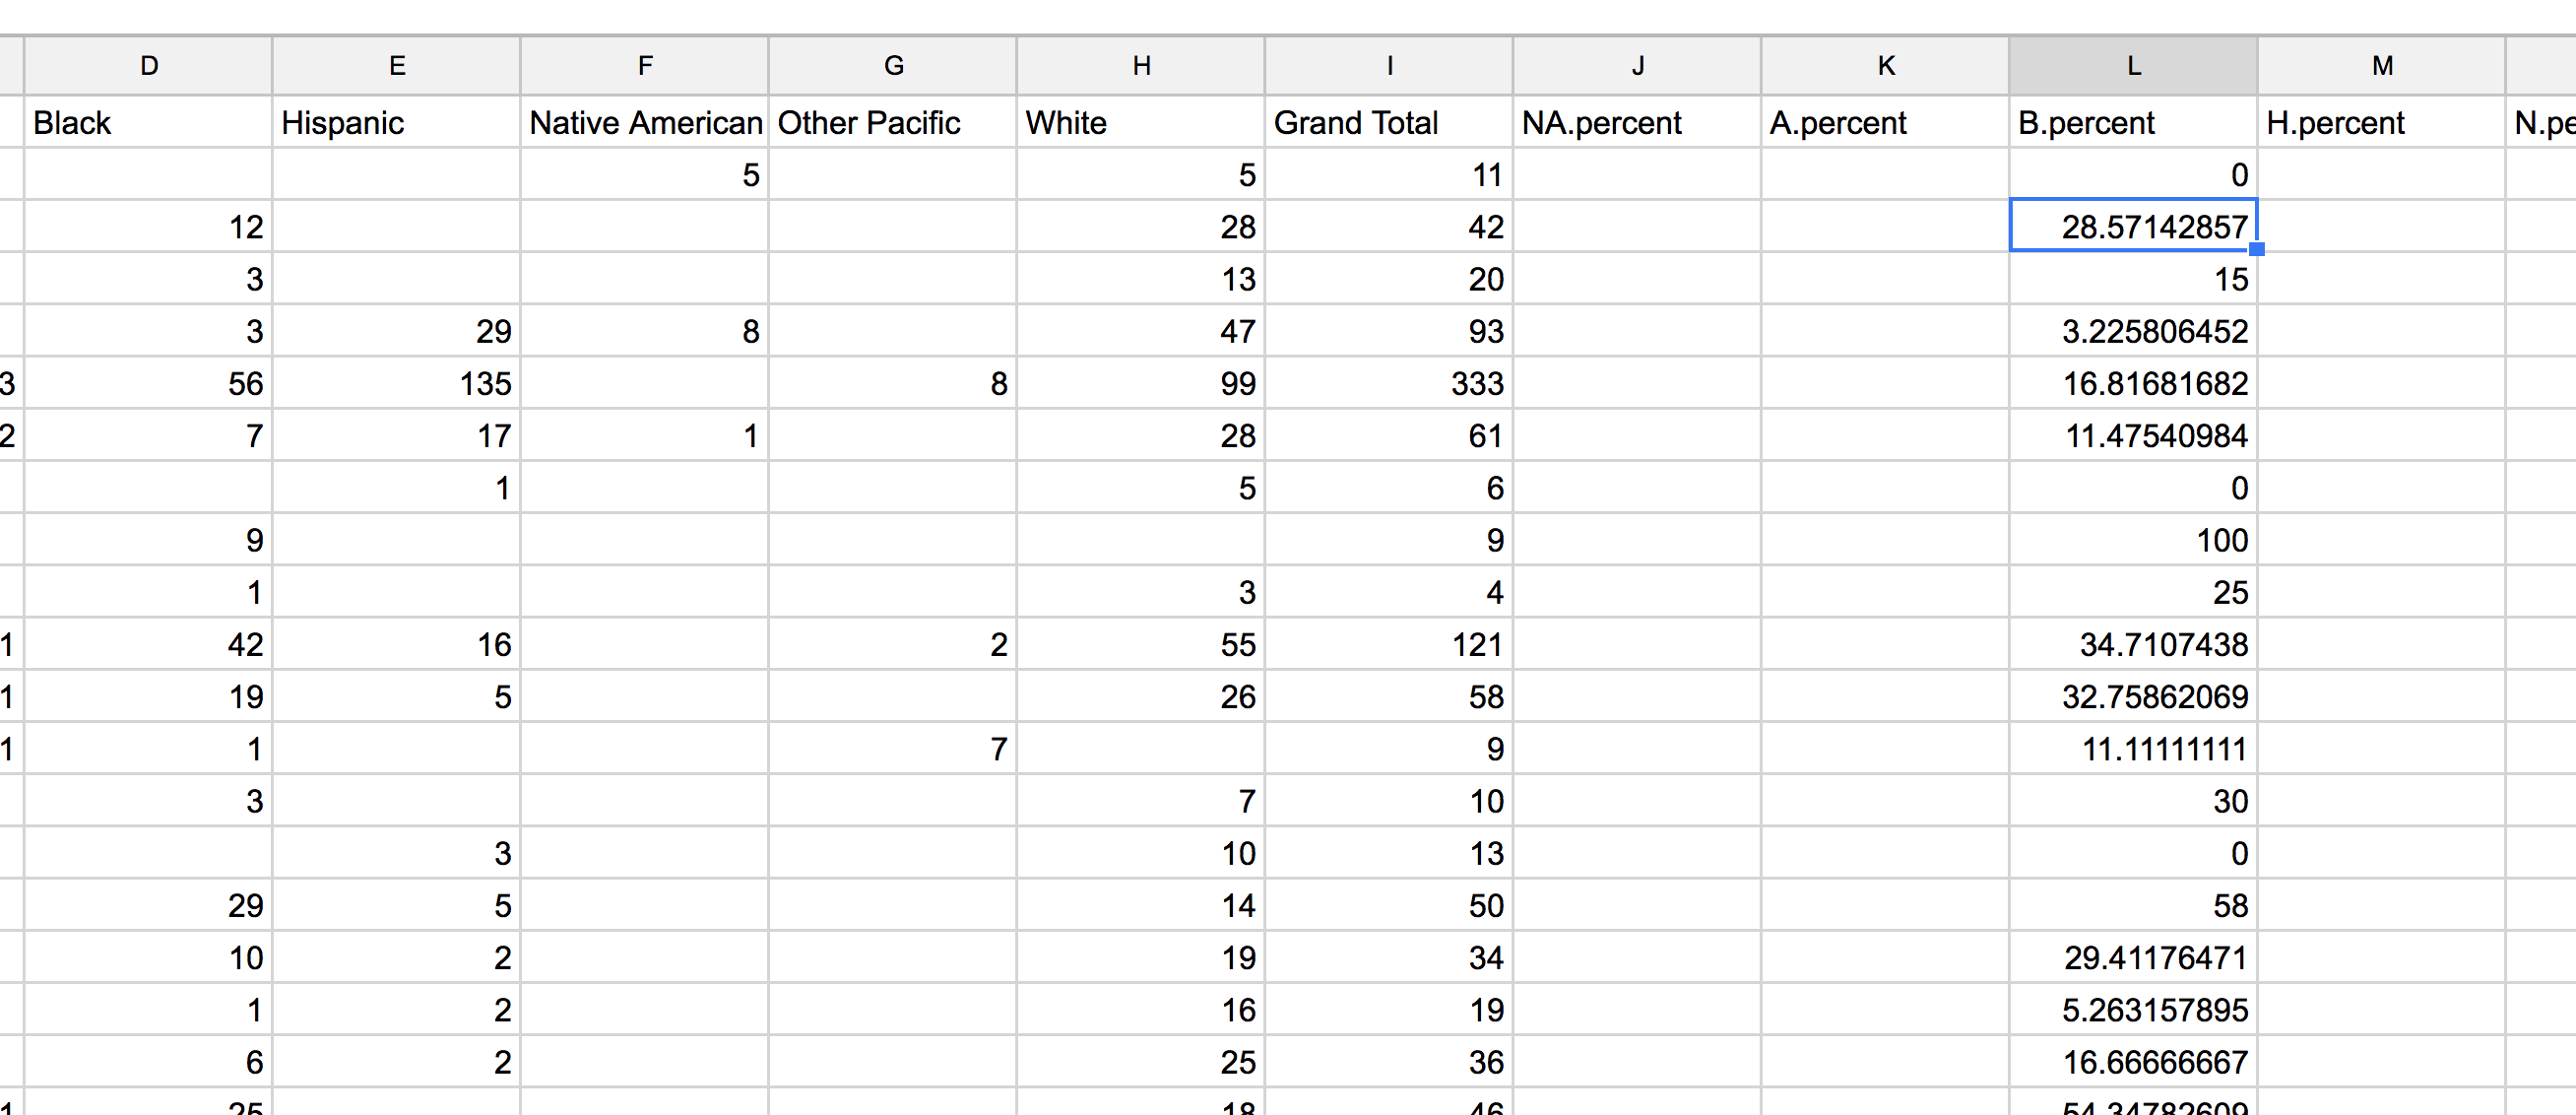
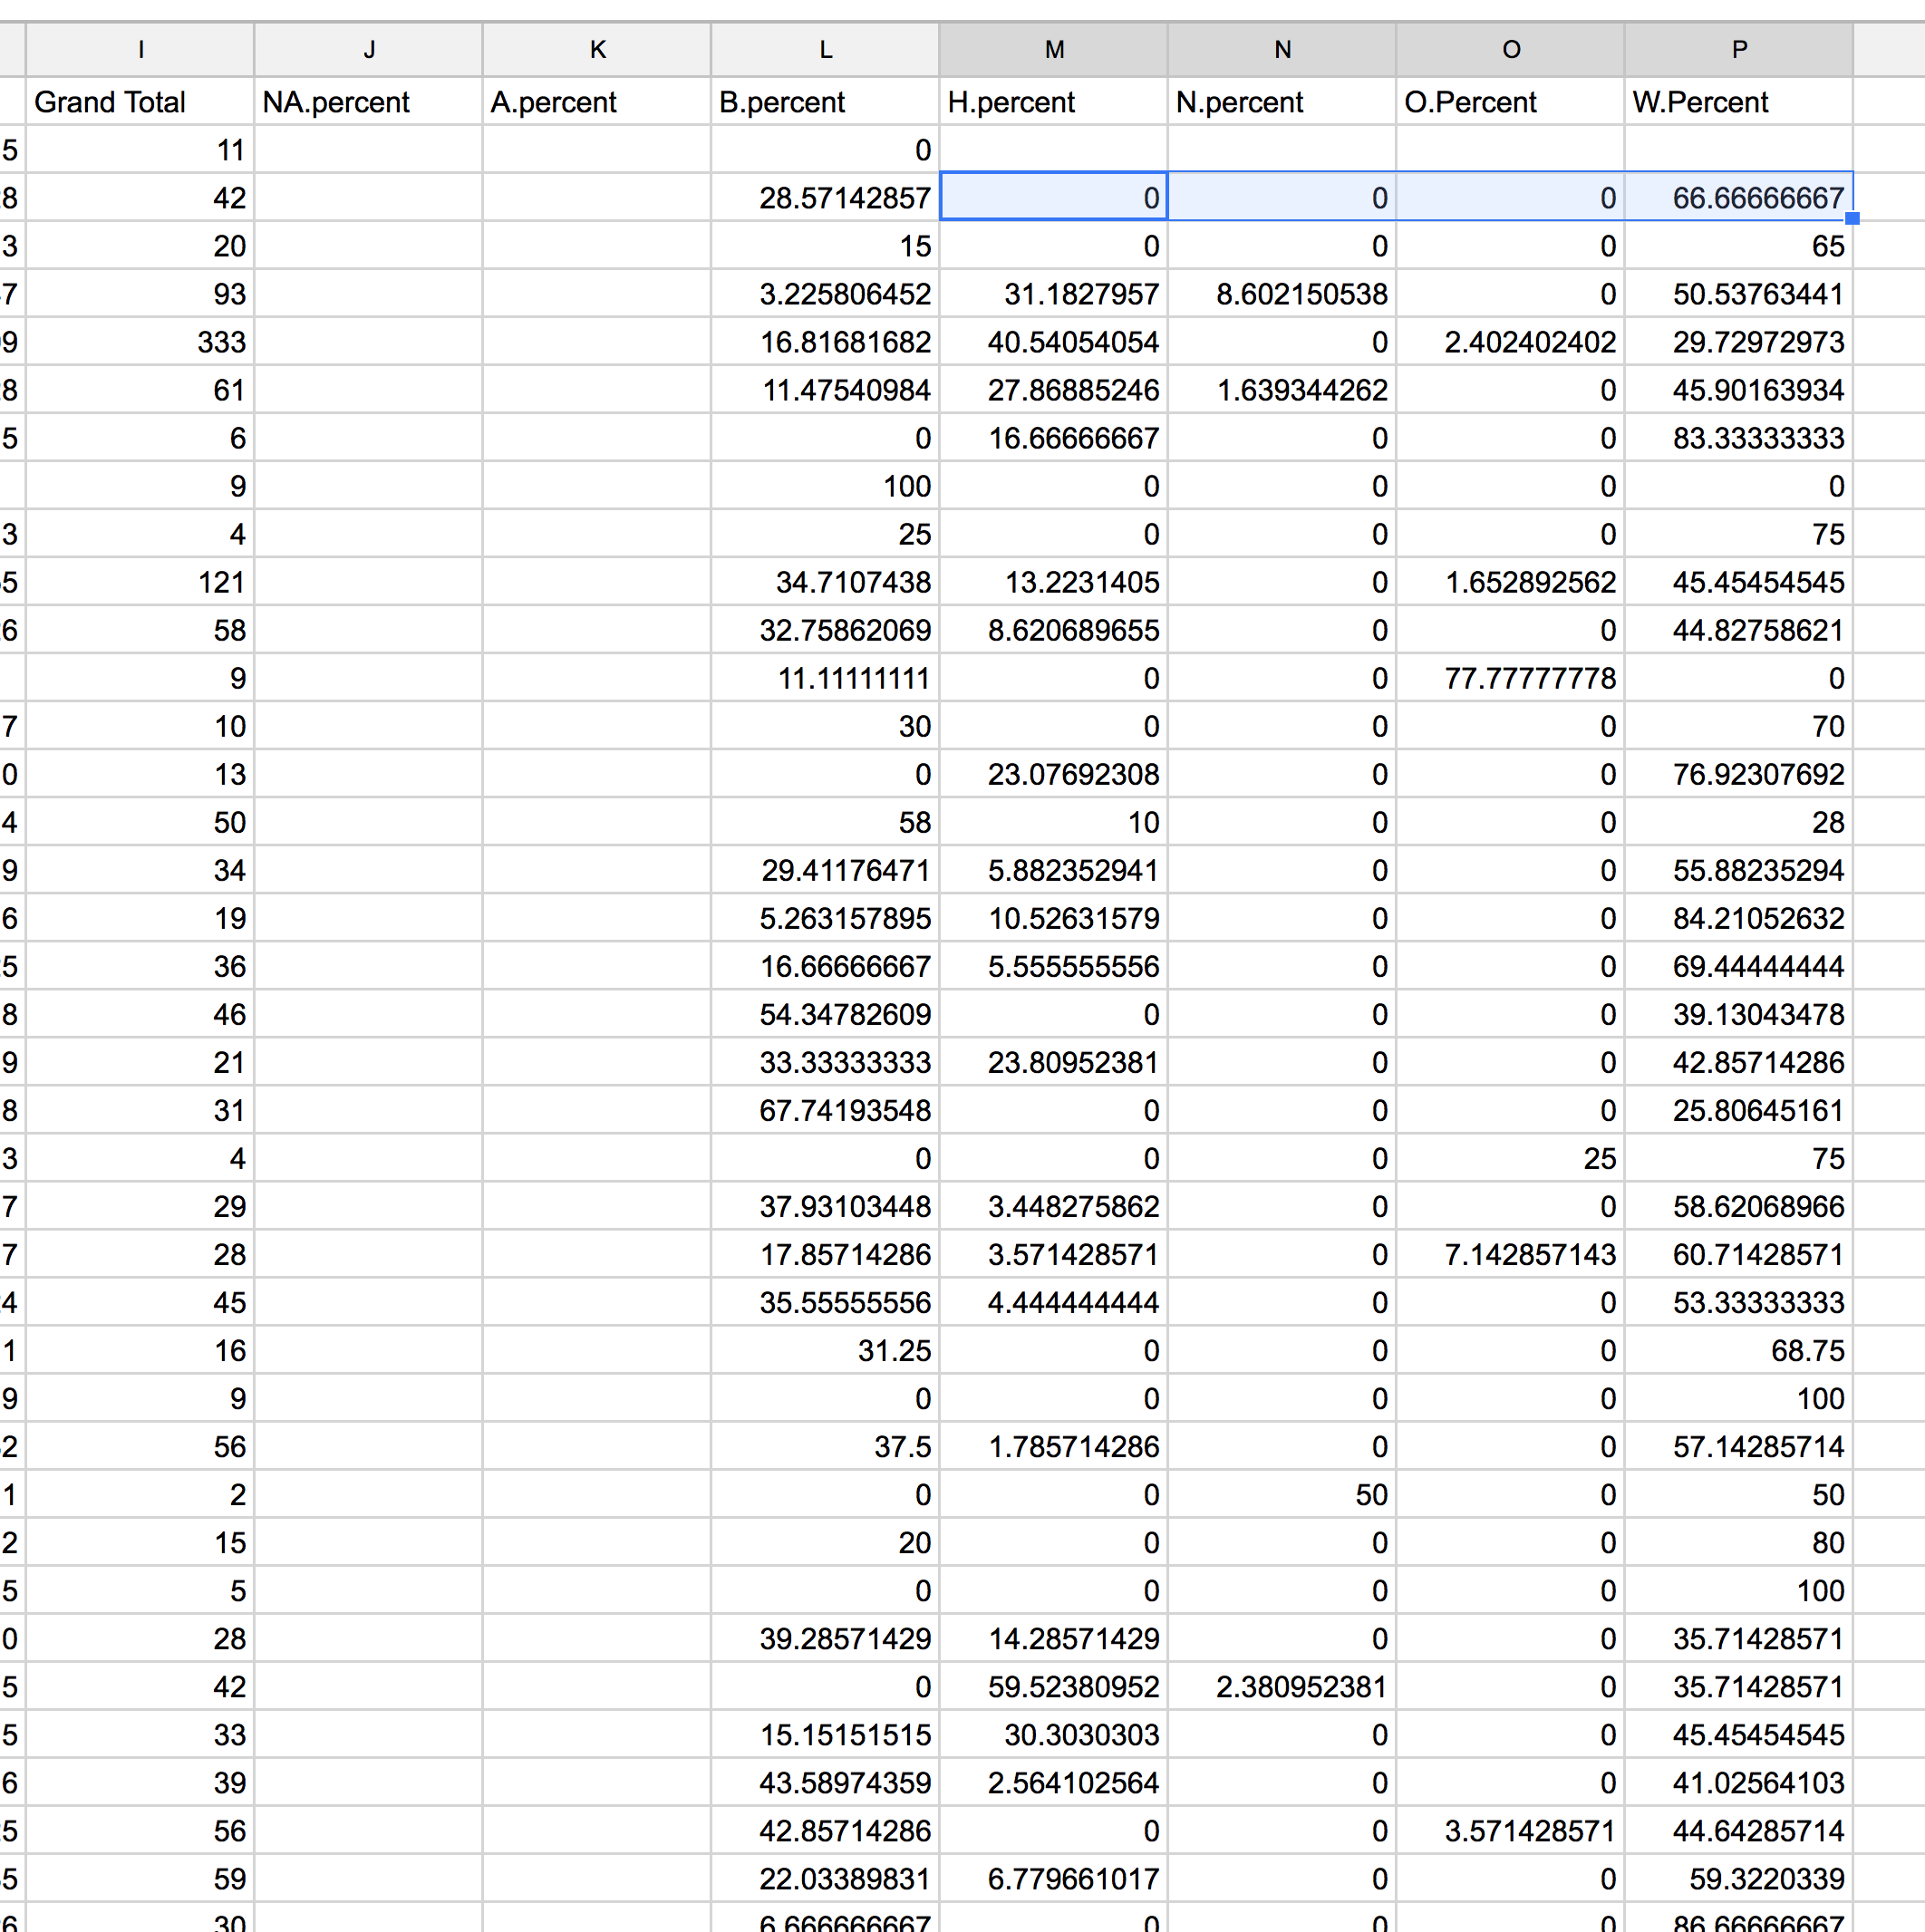
Alright, copy and paste that formula into the other rows and columns where they’re needed so everything is filled out.
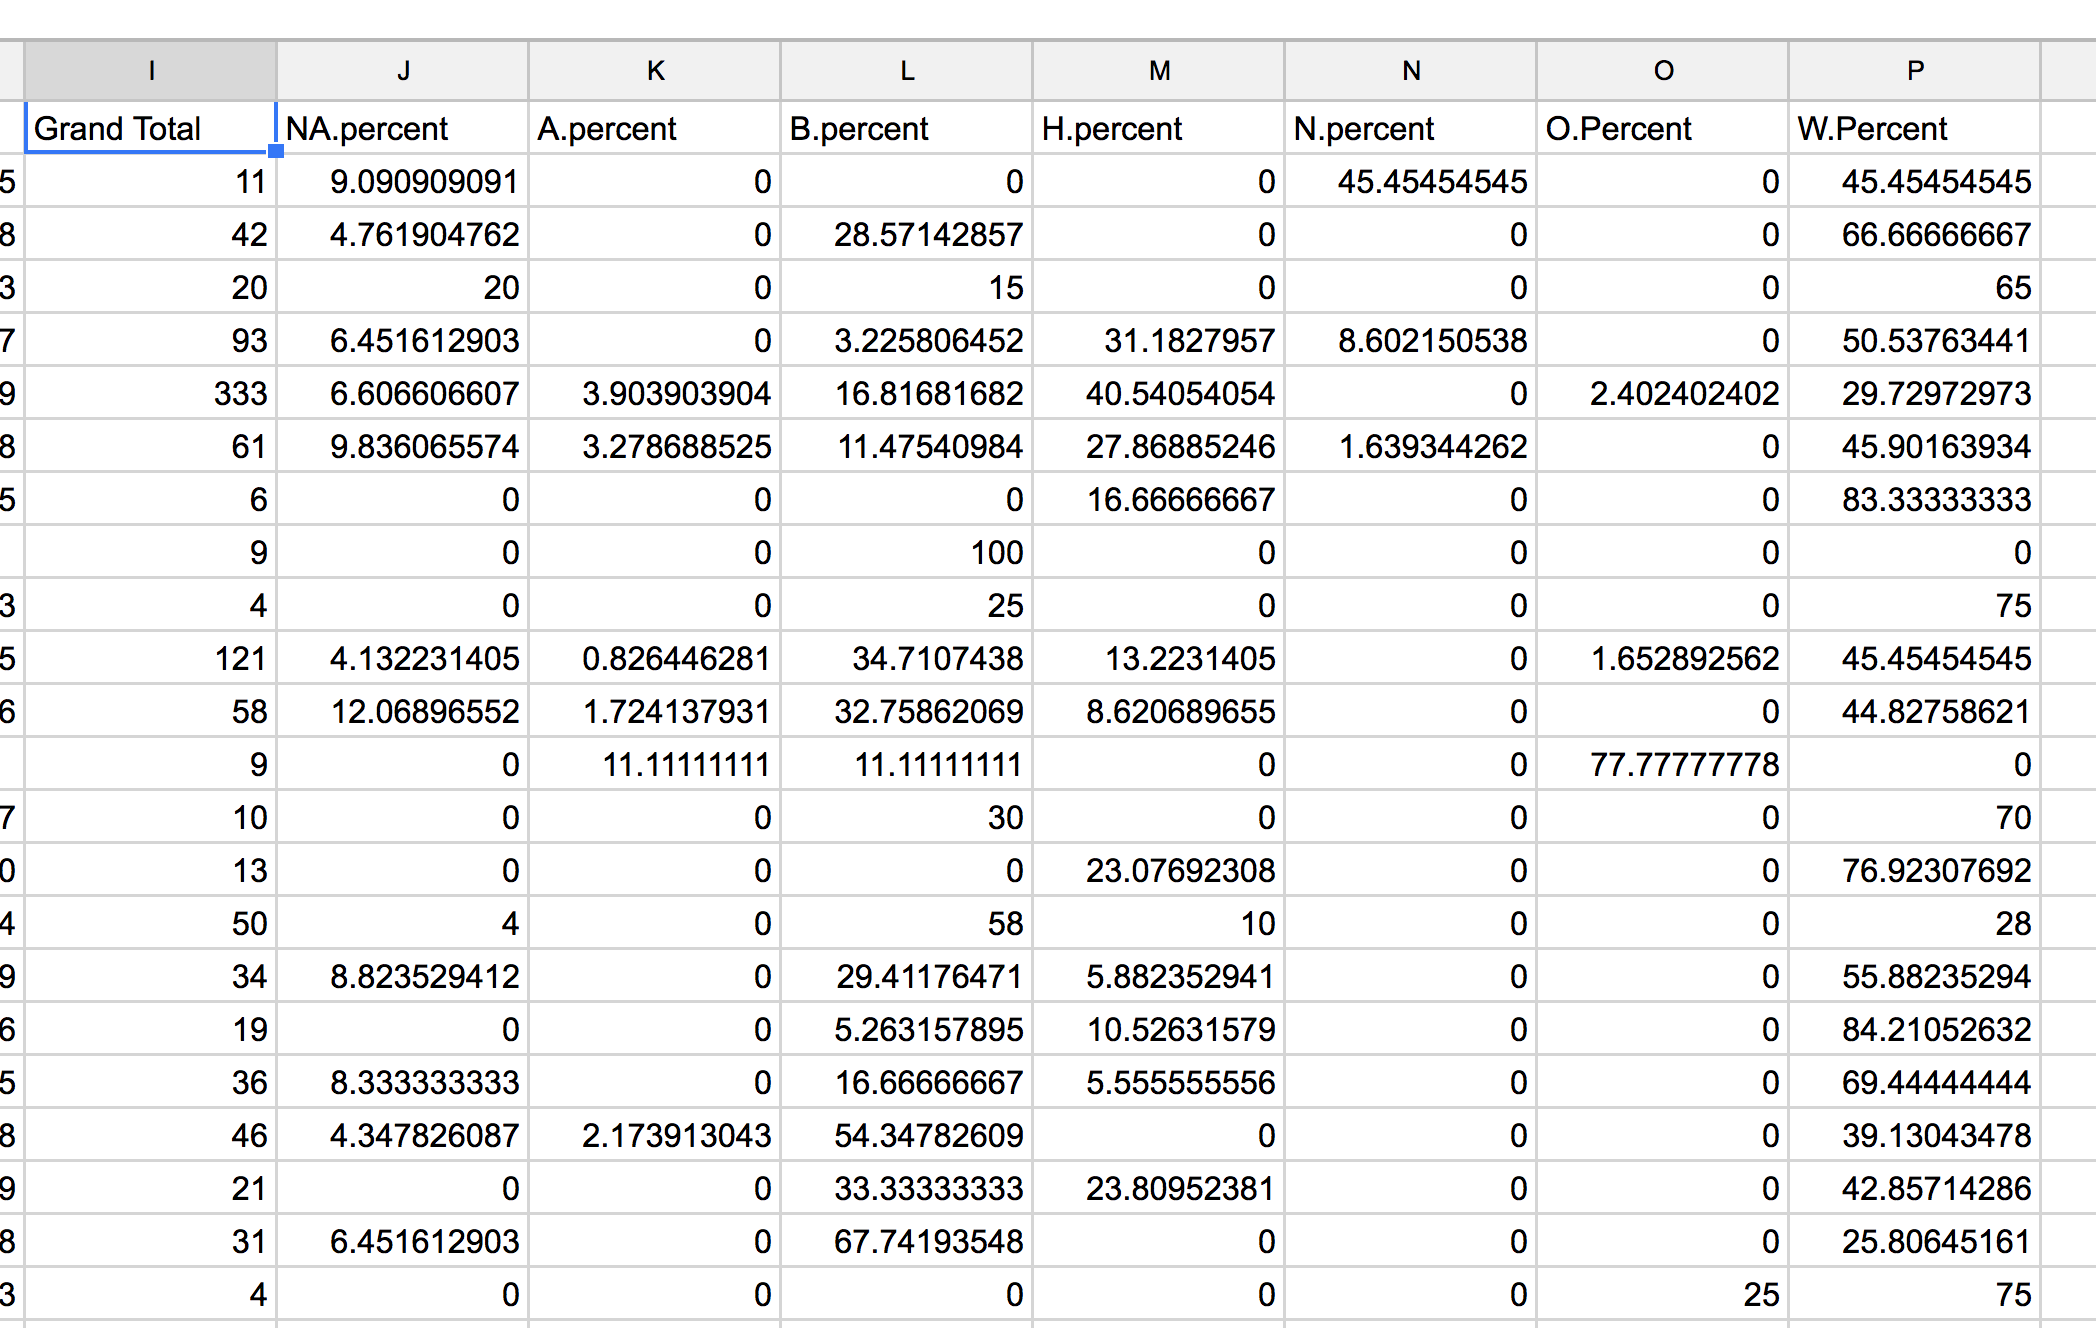
That looks very nice.
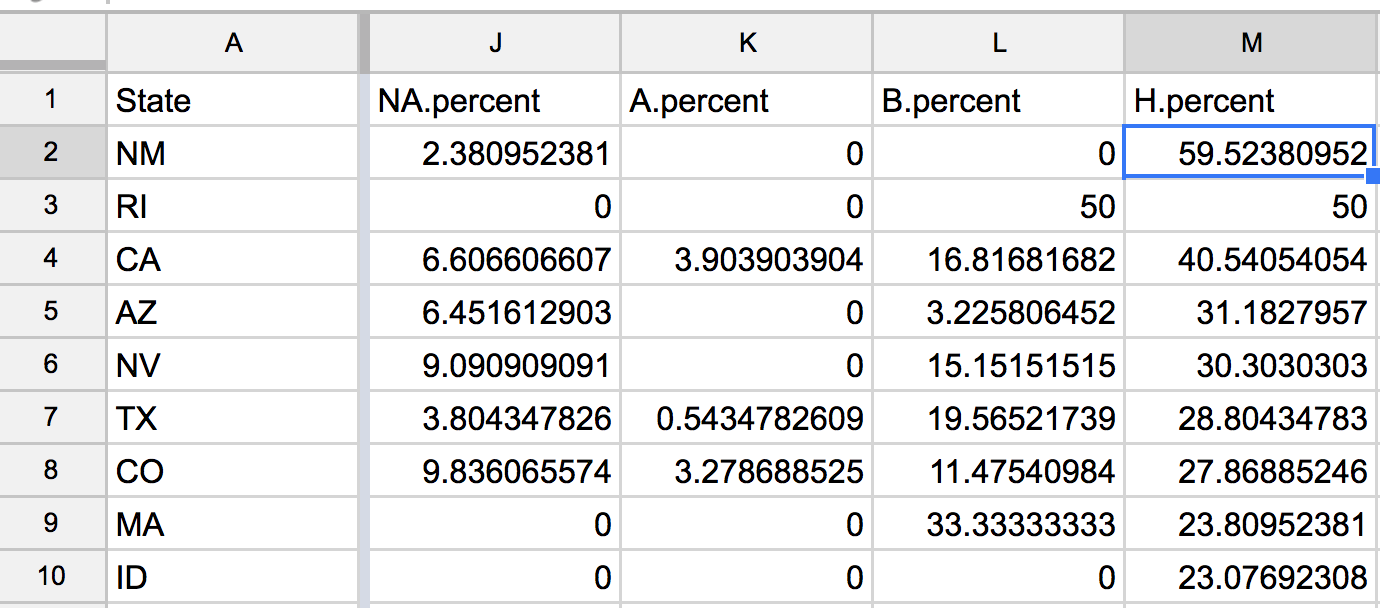
Alright, now back to the original question: In which state do Hispanics get shot most often compared to others?
Just sort the H.percent column Z-A
Note Don’t forget to freeze the first row first
View > Freeze > 1 row
Looks like New Mexico and Rhode Island have the highest percents in the country (59.5 and 50 percent).
Note You can freeze the first column so it’s easier to see which state lines up with what row. (
View > Freeze > 1 column)
Another note Rhode Island only has two total shootings. The small sample size will throw off the percent so that should be noted if you write a story about that.
Subtraction
Another question we can ask and answer is Which states have the widest gap between percent of black people shot and white people shot?
Label the last blank column (should be Q) Black.White.Gap.
And put in the formula that subtracts B.percent from W.percent (Hint, it’s =L2-W2).
Double click the little blue square and apply that formula to all the rows.
Then sort it highest to lowest.
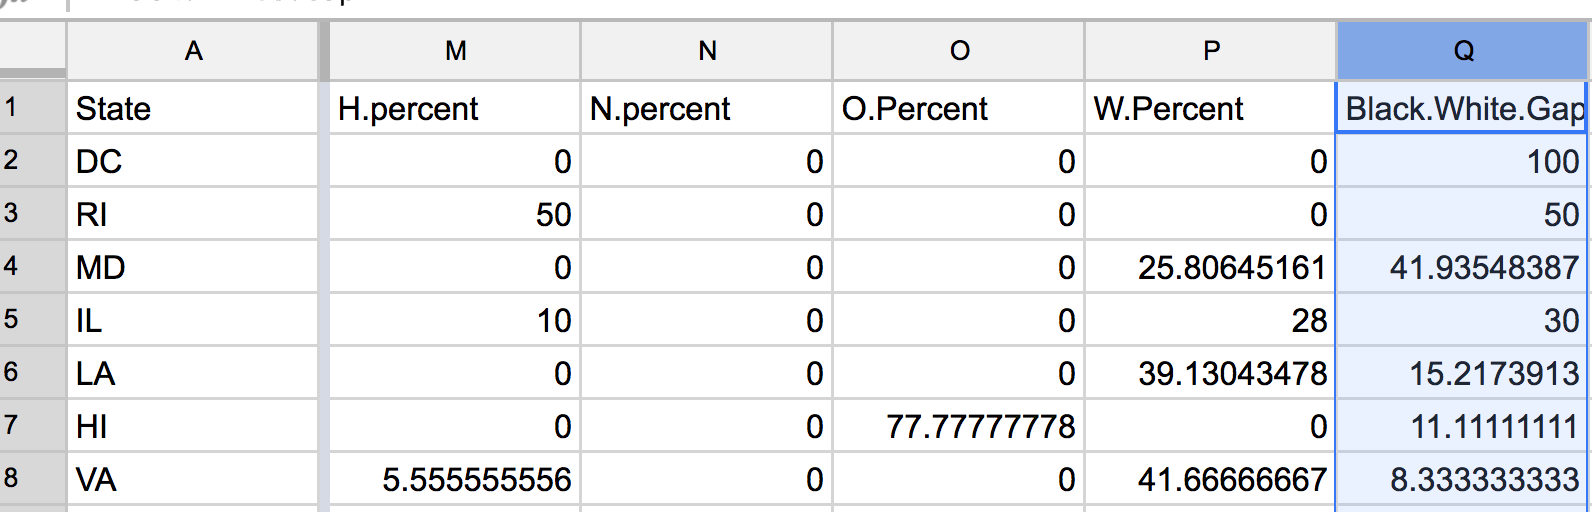
At the top of the spreadsheet, you’ve got the positive numbers.
That’s where there’s a higher percent of blacks shot versus whites shot.
Washington DC, Rhode Island, and Maryland have the most at 100, 50, and 42 percent. (Remember, Rhode Island only had two total, which diminishes the significance of that high percent).
But look in the other direction. New Hampshire, Montana, Utah, Connecticut. The gap between whites shot and blacks shot by police is also large.
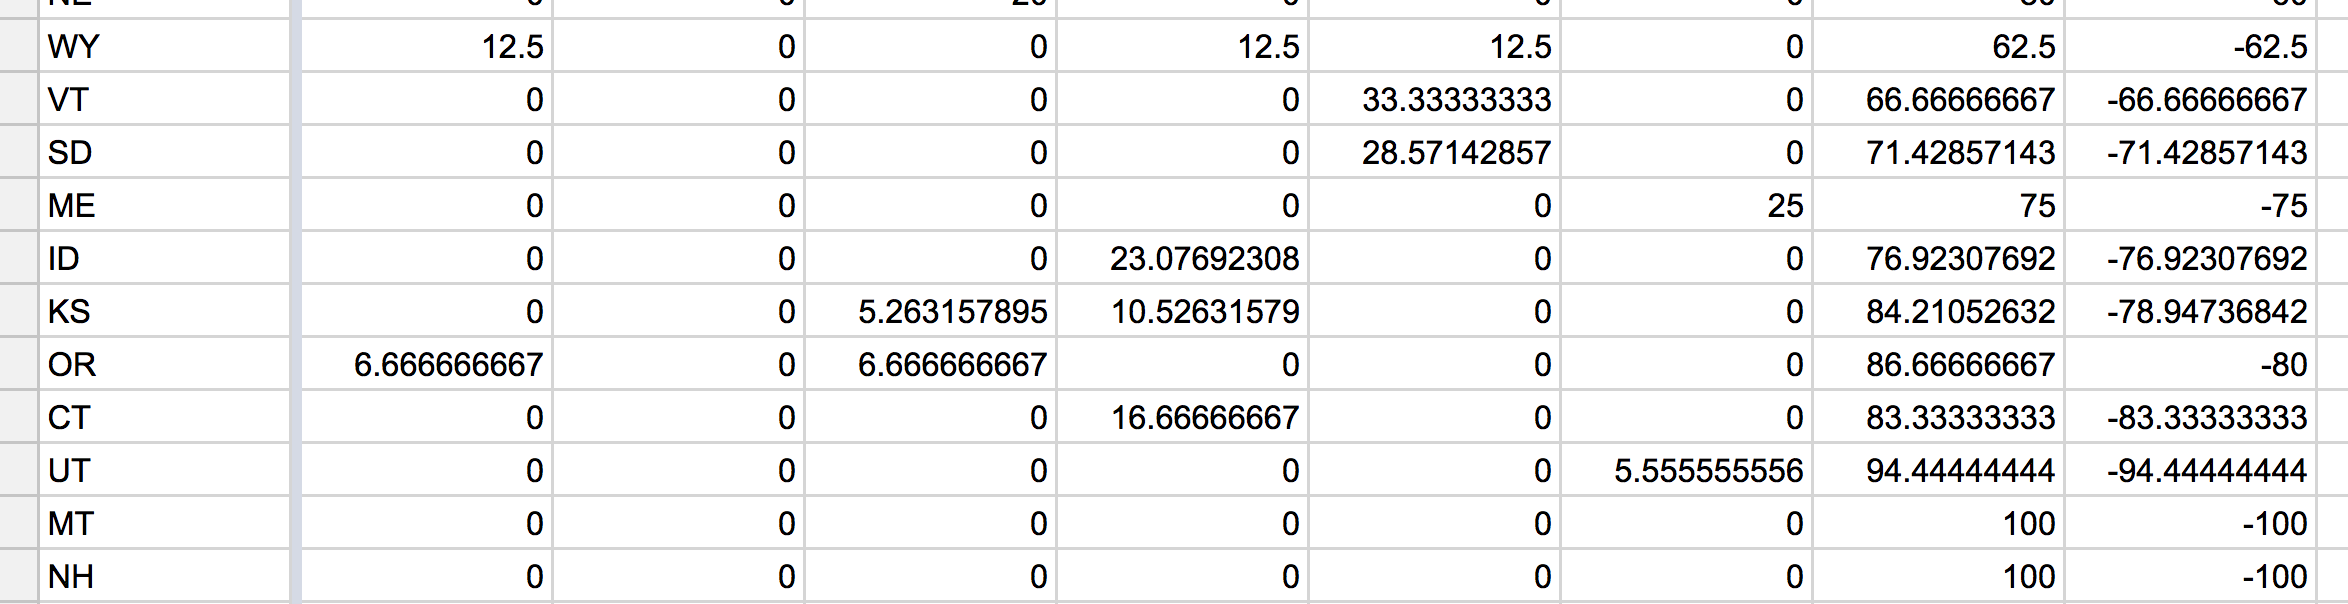
A lot of what can explain for these percentages is the percent of the population in each of these areas.
More white people as a percent of the state would logically lead to the conclusion that more white people will be shot.
Note The best way to normalize these numbers is to take into account the population for each of these races listed in the spreadsheet in each state to determine the number of whites or blacks shot by police per capita. This process evens it out and brings forth real trends.
Extra credit question
What would you put it the pivot table Report Editor options to answer this question:
- Which states have the largest disparity (gap) for those who show signs of mental illness versus those who don’t?
- Put the quesiton another way: If you’re an Asian person suffering from mental health issues, in which state are police most likely to shoot you if you confront them?
(This is to get the raw totals before you copy and paste it into another sheet to do the math to find the percents)
WHAT’S NEXT
- V Lookup
- If statements
- Splits
- Concatenate