Extracting data from a PDF
Sometimes you will be dealing with
If you’re lucky, you can select the table from the PDF and copy and paste it over to another sheet.
If that works, great!
But sometimes the format gets wonky.

Fortunately, people have been working on ways to free data trapped in PDFs.
All the options above are popular choices but have pros and cons.
Tabula
- Pros: No limit to amount of documents, allows control of what section of the PDF to select/download
- Cons: Really slow. If many people using it on the same IP can create a bottleneck.
Nitro
- Pros: Fast
- Cons: Faster for people who pay. Honestly, I don’t use this. I use the option below.
Cometdocs
- Pros: Fast, multiple output options like Excel, Word, etc.
- Cons: A limited amount of PDFs allowed to be converted a month. However, if you’re a member of IRE, you can get a free upgraded account. I recommend you go that route.
Go to Cometdocs and sign up.
| [Login | Cometdocs](http://www.cometdocs.com/user/login) |

This is the main page. There are four tabs in the middle:
- Convert
- Transfer
- Store
- Host
Above that is the area you can upload PDFs.
Download these 3 files and upload them into Cometdocs.
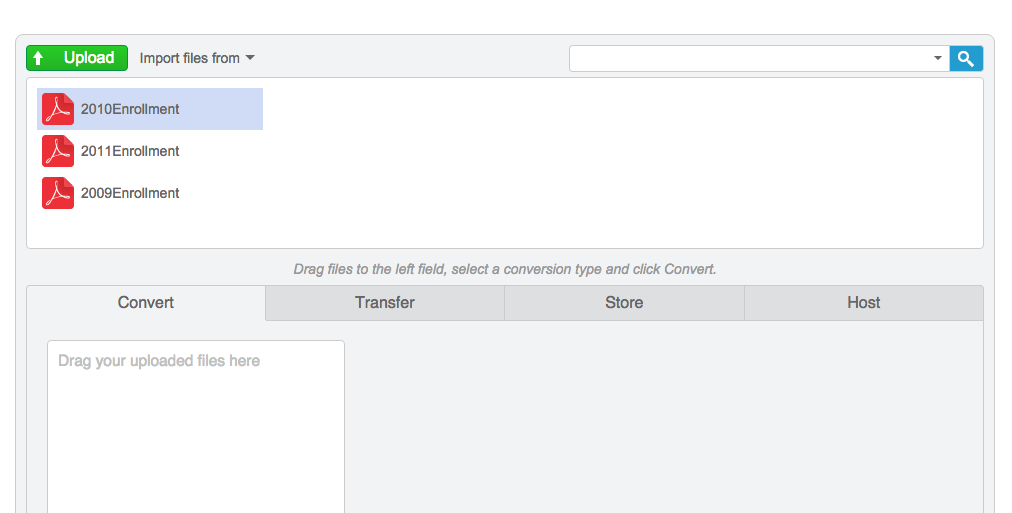
The files are now in the staging area.
Click on the Convert tab and drag each file from the staging area into the Convert box.

Select to Excel (xlsx) and then click the Convert button on the right.
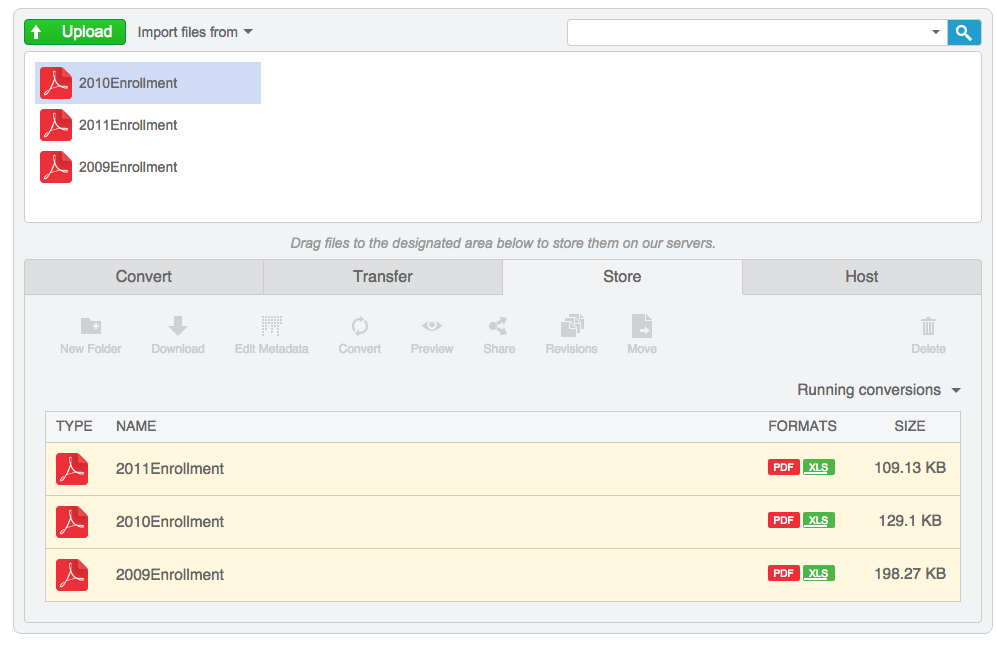
It will switch to the Store tab and a bar will move under the XLS button until it stops. That means it’s ready to download.

Click to download and go back and download the rest of the spreadsheets.

Bring the files into Google Sheets.
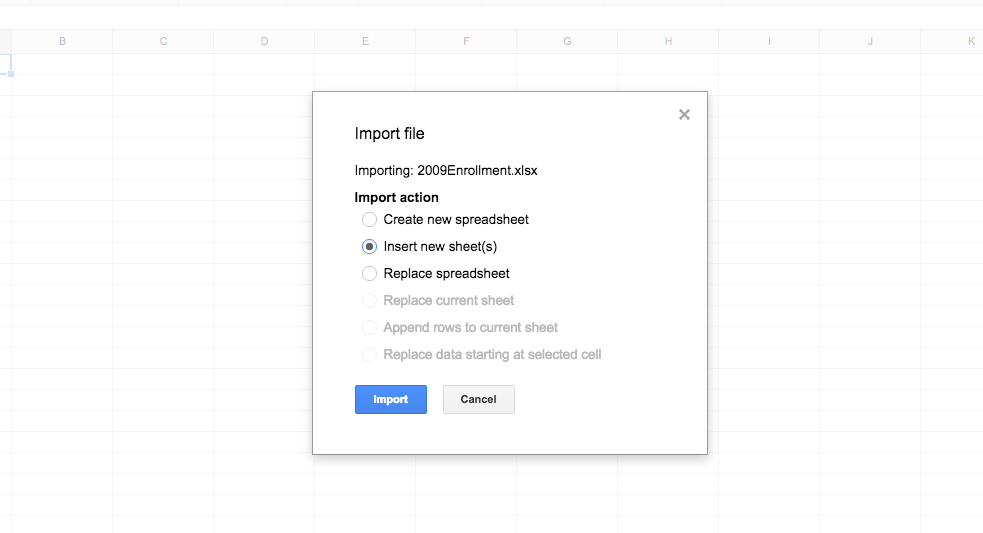
OK, looks like it worked. But now it will require some massive cleaning up.
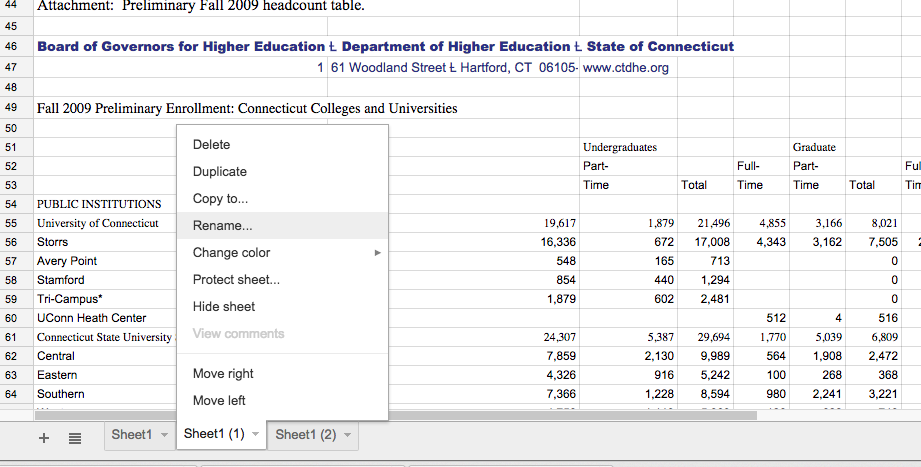
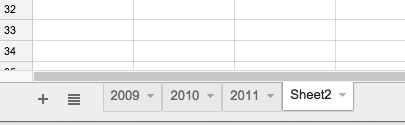
Rename the sheets to 2009, 2010, 2011 and also delete any blank sheets.
We need to be organized.

OK, let’s get rid of all rows with extraneous rows.
We’ve now reached the point of organizing data. What we do next depends on what we want to do with the data.
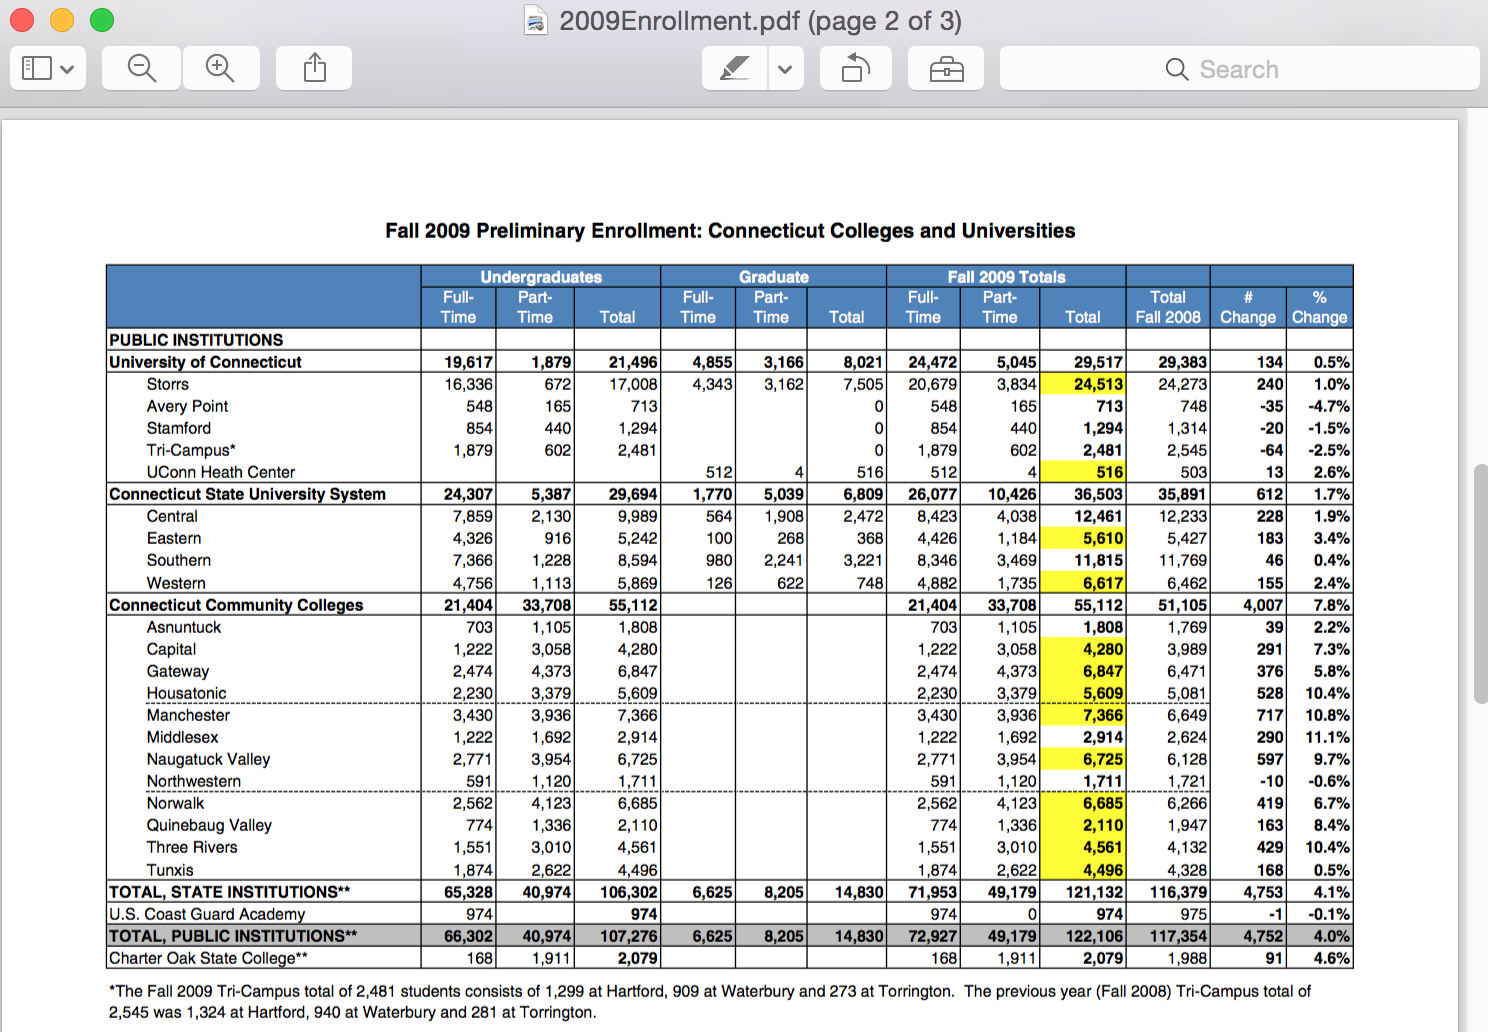
You can always refer to the original PDFs to see the way the structure is laid out.
We have three years worth of data on college enrollment.
For each sheet, the colleges are sub categorized by what system they are a part of. There’s also separate data for subtotals, totals, and Coast Guard.
There are many ways to visualize this data.
Let’s start simple.
Chart out the Full-Time Undergrad total for 2009, 2010, and 2011
To do this, we need to pull out the data and put it into a separate sheet.
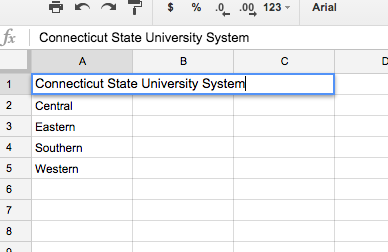
First, create a new sheet at the bottom.
Name it CSUS
Copy and paste the names of the colleges we’re focusing on over into the new sheet:
- Central
- Eastern
- Southern
- Western
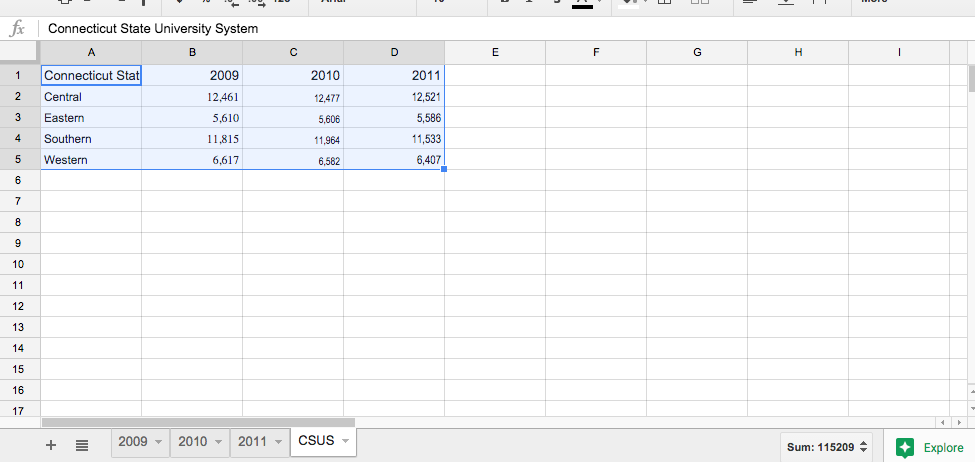
Leave a space in the first row so you can name that Connecticut State University System. We have to stay organized.
Find the data that matches the 2009 total enrollment figures (Look at the PDF if you need help narrowing it down)
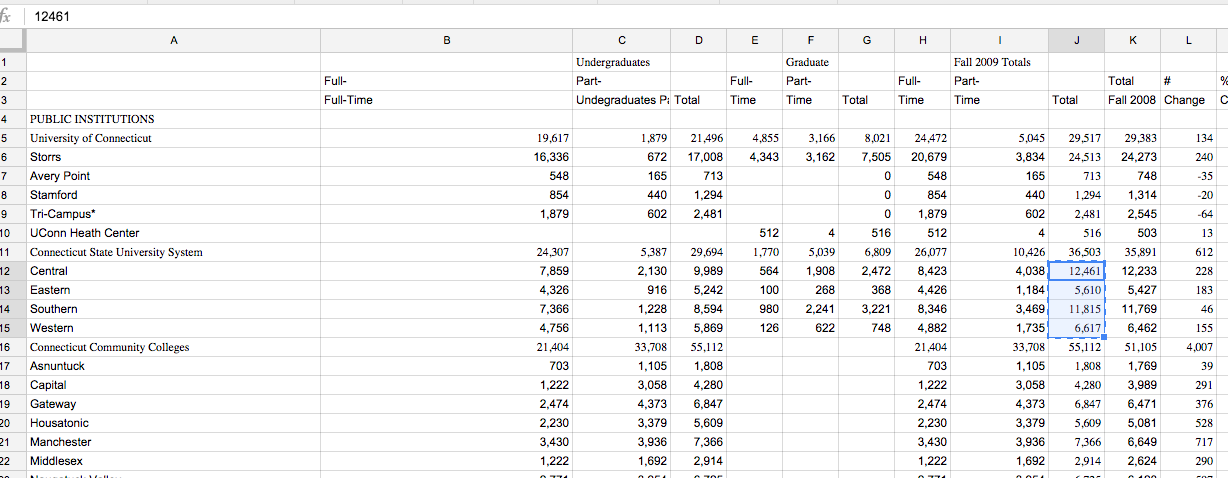
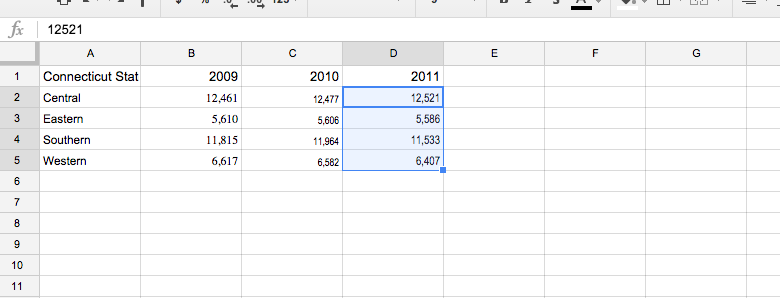
Copy and paste those numbers into the CSUS sheet next to the school name.
Leave a space in the first row so you can name that 2009.

Do this for the other remaining years for Full-time students enrolled. You don’t have to bring the names in because you’ve already done it.
Here’s a quick new trick from Google Spreadsheets.
Select all the data you’ve got and click on the bottom right plus button that says Explore.
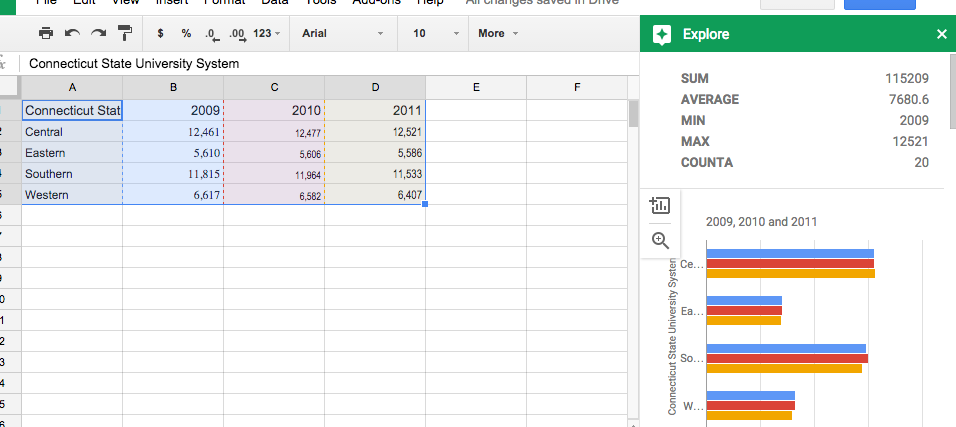
It will pop open a window of preliminary analysis of the data.

You can see what sort of options you have for visualizing the data.
In this example, it won’t work well because Google Sheets is interpreting 2009, 2010, 2011 as numbers that instead of headers.
Let’s take the data over to plotly, though.

Paste it into the plotly environment.
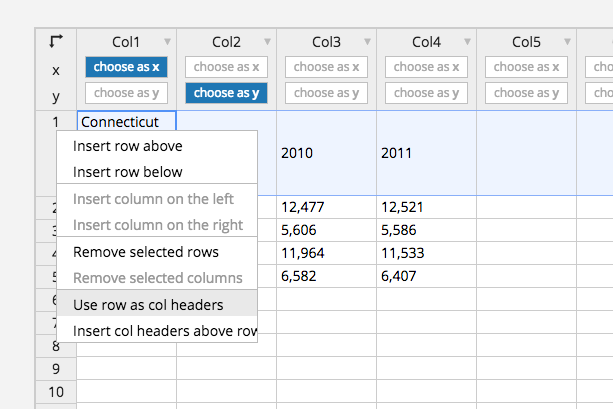
Right click the first row and select Use row as column headers

Select the choose as y button above 2010 and 2011
And then click on lineplot.

Does that look right to you?
Nope.
We’ve mixed up the data. The lines should represent each college, not year. And the X axis should be the year, not college.
Click on the Grid tab at the top left to go back to the data.

Delete the data.
Go back to the spreadsheet.

Select the data, copy it, and in a row below it, right click and Paste special.
Select Transpose.

It has pivoted the data so the rows are now columns and vice versa.
Rename the top left cell Year
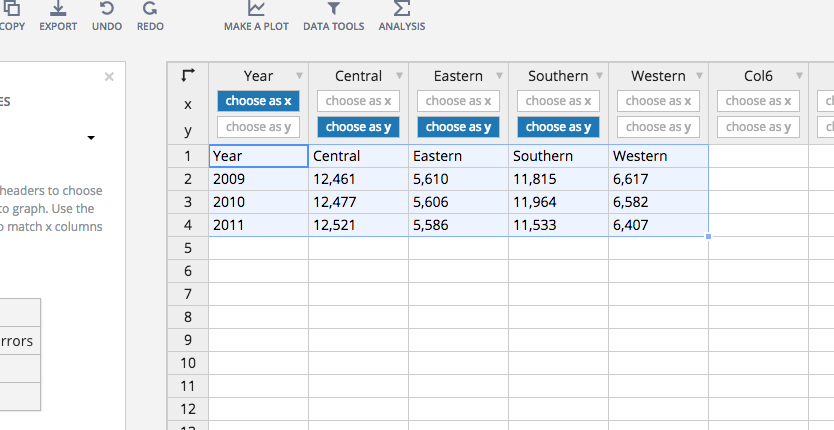
Copy and paste the new data into plotly.

Set the first row to “Use row as col headers” and select choose as y above Western.
Then select Line plot at the bottom left.

Looks pretty good.
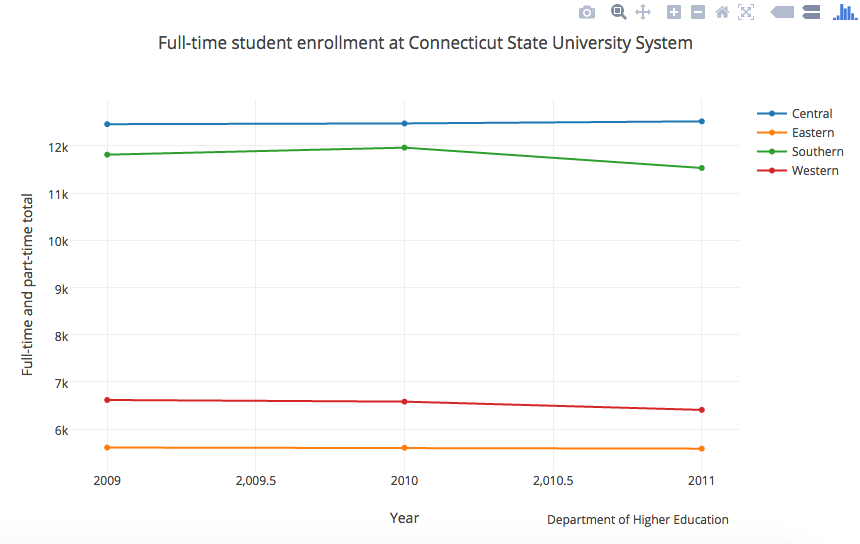
I added a title, labels for the X and Y axes.
And I added a note at the bottom right sourcing the data.
There are plenty of other types of charts to choose frome.
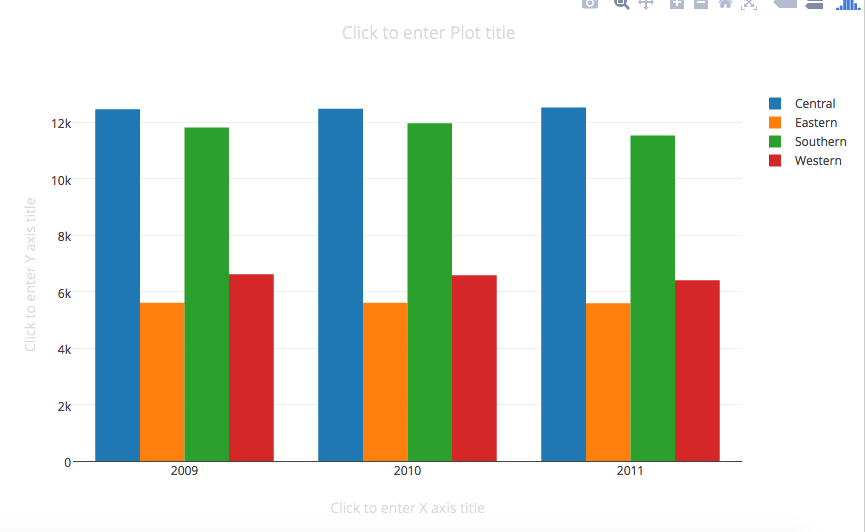
This is what the bar chart option looks like.